


Pros and cons of price action trading
Chart patterns for price action trading
Support and Resistance Strategy
In 2008, the global financial markets experienced one of the worst years in decades. The S&P 500 declined by 40%, the DAX by 41%, and the Nikkei by more than 40% during the global financial meltdown caused by the financial industry's deregulation. This deregulation led to banks' increased risk-taking and the collapse of leading Wall Street firms like Lehman Brothers and Bear Stearns. After the crisis ended, the S&P, DAX, Nikkei, and the Dow Jones Industrial Average (DJIA) climbed by 256%, 200%, 174%, and 235%, respectively. Investors who invested in stocks before the crisis have more than doubled their investments, which is an excellent example of how the trend can be your friend in the market. Price action trading involves identifying trends as early as possible and seizing opportunities. Technical analysis is essential as traders believe past trading patterns can determine future movements.
Price Action Trading (P.A.T.) is a trading technique that involves making decisions based on the 'naked' price chart. Price action means that traders do not use lagging indicators. However, some traders may use a few moving averages to identify dynamic support and resistance or read the trend; thus, PA focuses solely on the price. While various economic news catalyses price movement, traders don't need to analyse it to make trading decisions. The reason is that all the news that causes market volatility is simply reflected via PA on the 'naked' price chart, without indicators.What is price action?
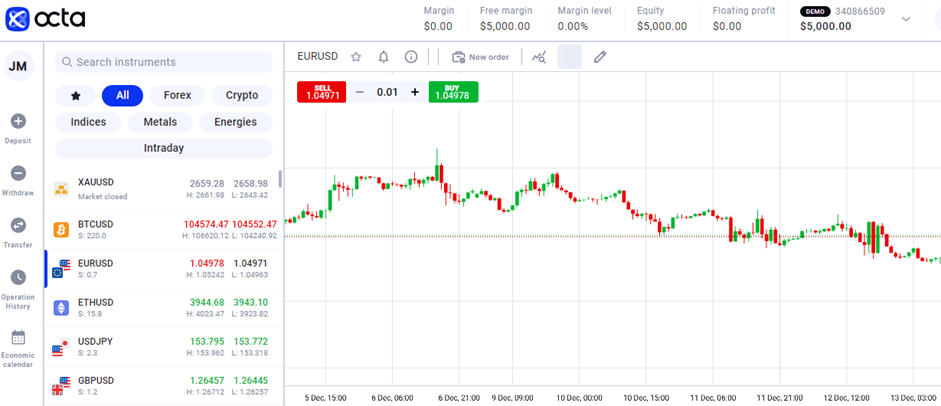
EURUSD 'naked' price chart
Since a price action reflects all the variables that move the market price at any given time, employing indicators such as stochastic or RSI is not necessary.
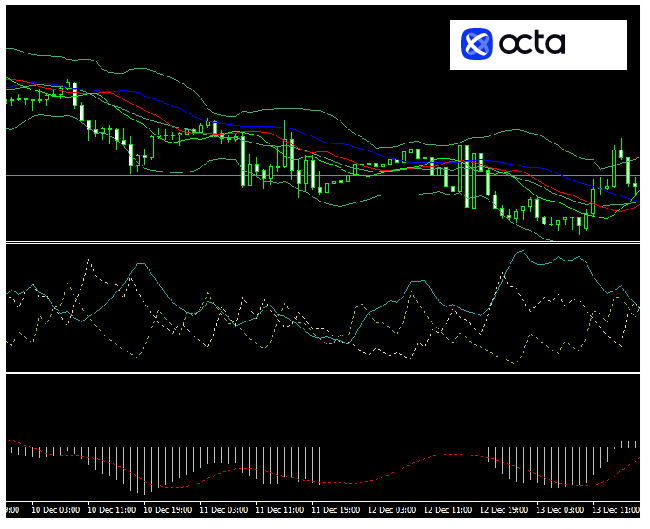
EURUSD 'Messy' price chart
Our article 'Technical analysis' contains more information about the terms of Forex trading.
When examining the price action strategy closely, it is essential to analyse its advantages and disadvantages. Let's examine the specific aspects of price action in Forex trading that are worth attention. However, price action trading does come with some drawbacks:Pros and cons of price action trading
Continuation Patterns are shapes that appear on a price chart when the price is already moving in a specific direction, like going up or down. For example, if the price rises and you see a triangle shape forming, it usually means the price will keep going up. Traders look for these patterns to confirm that the trend will continue before deciding to buy or sell. Price Action Reversals indicate that the trend might change when the essential rules are broken. For instance, in an upward trend where prices keep increasing, if the price drops lower than a previous low, it could signal that the trend is weakening. A reversal might be coming if another lower high follows this drop. However, it doesn't always mean the trend is over; things could shift soon.Price action trading patterns
Candlestick patterns can take many forms, but let's consider the most common ones and highlight how they differ from each other. An Inside Bar has two bars (or candles). The smaller bar is entirely within the range of a larger bar, called the 'mother bar'. Inside bars usually happen when the market is stable, but they can sometimes trick traders into thinking a trend is changing. Skilled traders look at the size and position of the Inside Bar to decide whether it means the market is calm or a trend change is coming.Chart patterns for price action trading
Inside and Outside Bars
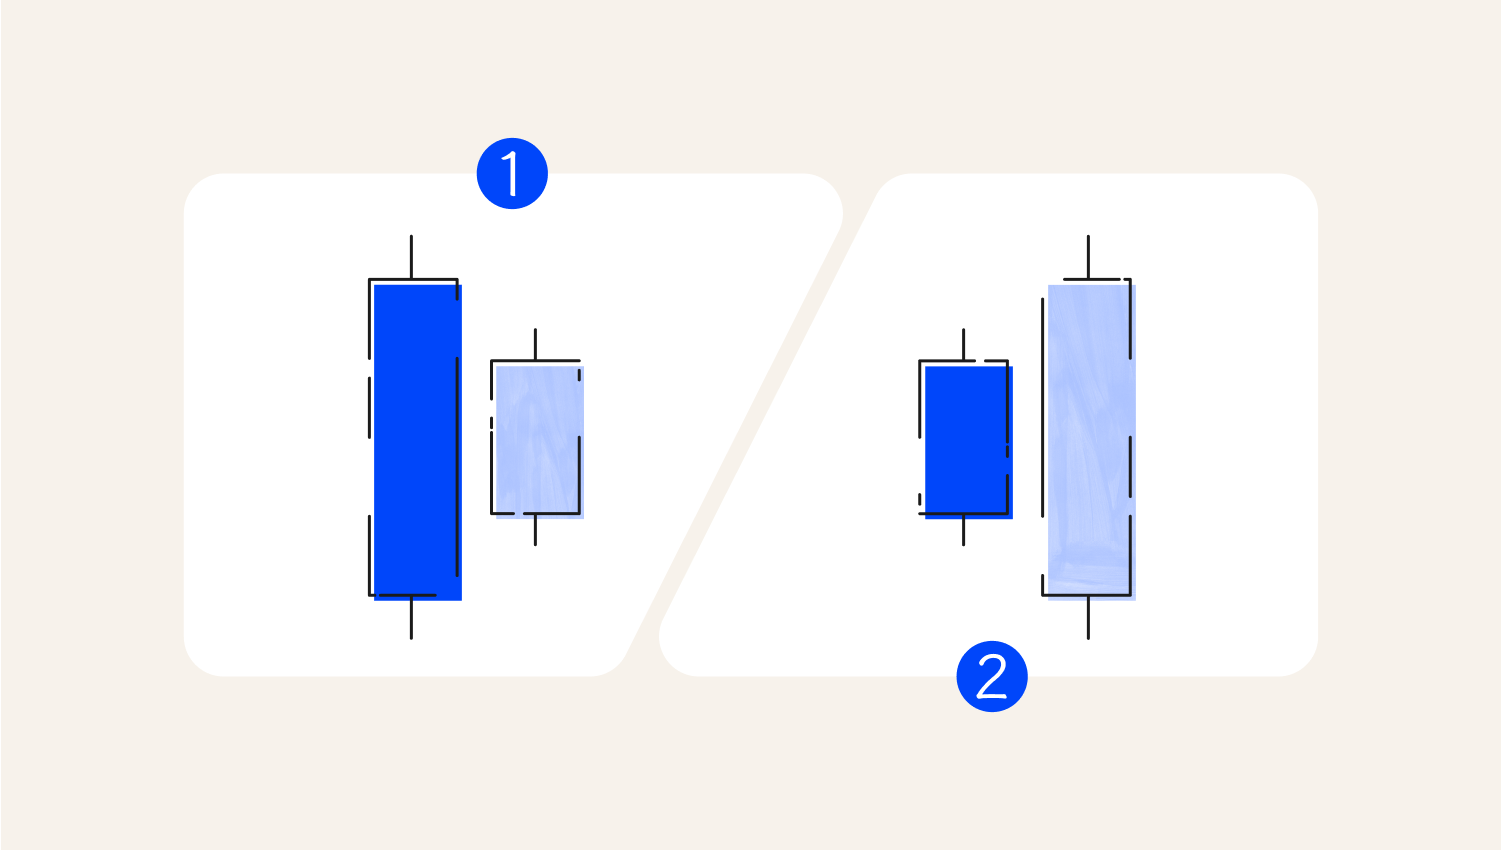
1. Inside Bar
2. Outside Bar
An Outside Bar is a candlestick pattern in which the current candle's range (high and low) is larger than the previous candle's range, indicating potential reversal or increased volatility in the market.
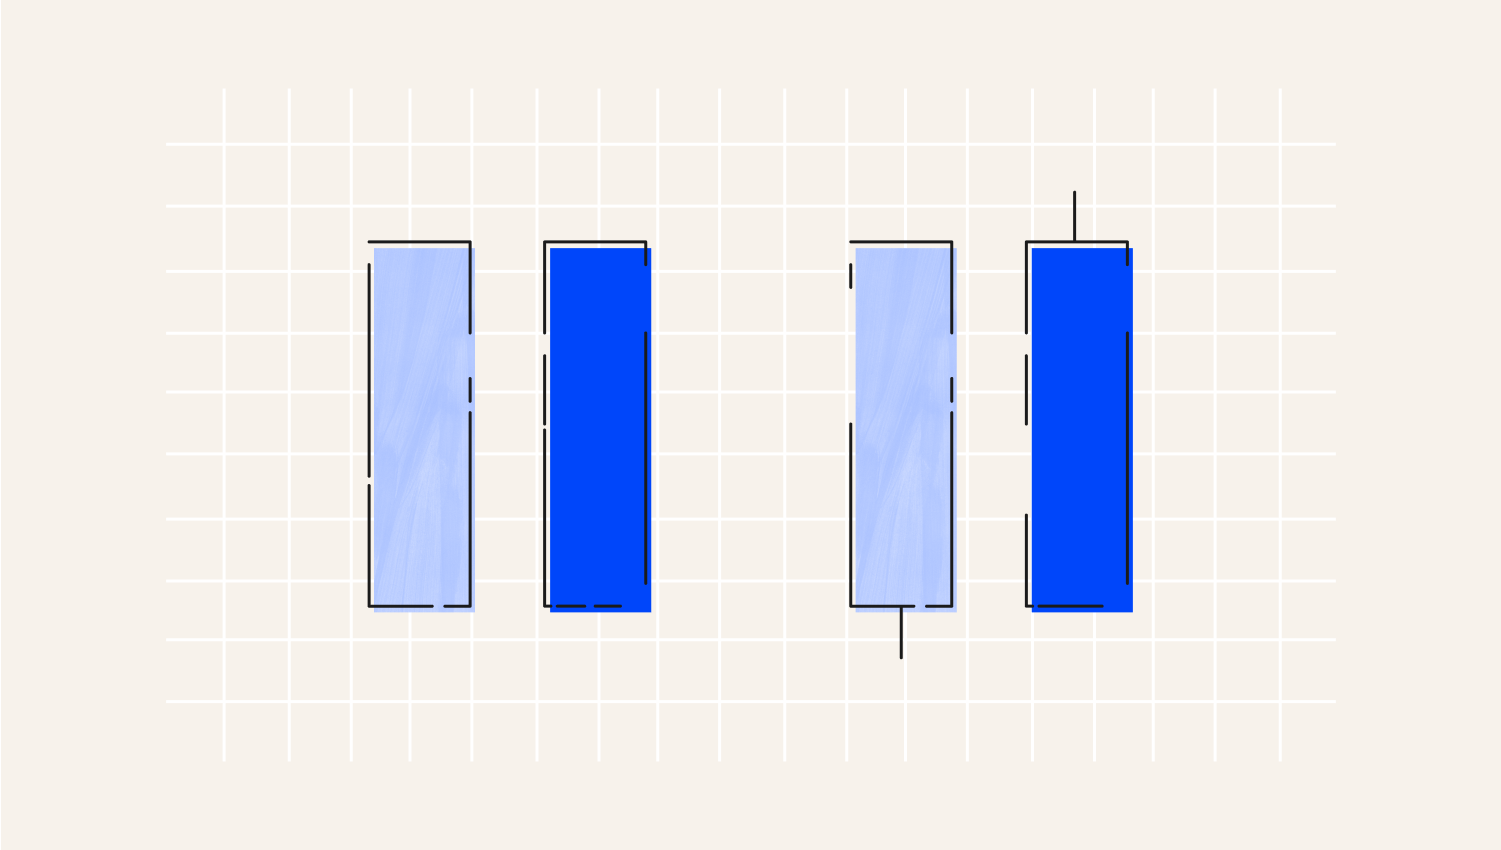
Marubozu Bars
The Marubozu is a unique candlestick pattern in Price Action, characterised by its singular structure and absence of shadows, which convey strong market sentiment. The term 'Marubozu', derived from Japanese, translates to 'bald' or 'shorn', aptly describing its appearance—this candlestick appears as if its tails have been 'trimmed', resulting in a clean, uninterrupted body.
Pin Bars
Pin Bars have long wicks, suggesting pressure from buyers or sellers to push prices in the opposite direction. The wick shows prices that were pushed away. For example, if a pin bar has a long wick at the bottom, lower prices are rejected, hinting that prices might increase.

1. Long wick
2. Small body
3. Short wick
One aspect of trading using the PA is trend identification. Trading with the trend, or simply put, 'trend following', is the highest-probability way to trade any market. The charts below show how to use price action to identify the trend. In a bullish market, the price makes higher highs and higher lows (HH, HL), while in a bearish market, the price makes Lower Highs and Lower Lows (LH, LL).How to identify a trend
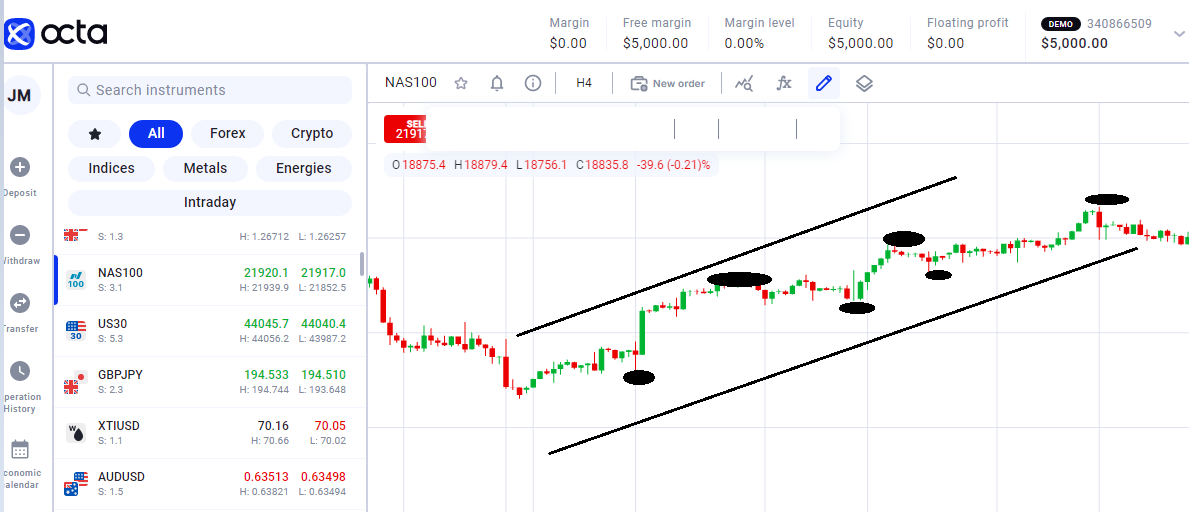
Below are a few price action trading strategies. The Trend Line Strategy relies on drawing trend lines—imaginary lines that help traders identify areas where the price might change direction. These lines serve as support and resistance levels. To draw a trend line, connect at least two consecutive points: two higher lows for an upward trend or two lower highs for a downward trend, creating a boundary that indicates the trend's direction. In trading, if the price approaches the trend line, it can signal a potential buying or selling opportunity. For a buy trade, traders place an order slightly above the highest price of the candle that touched the trend line, with a stop loss set below it. Conversely, for a sell trade, the order is placed below the lowest price of the candle that touched the trend line. It is also essential to look for specific candlestick patterns that indicate possible reversals, as they can confirm whether the price will bounce off or break through the trend line.How to trade on price action
Trend Lines Strategy
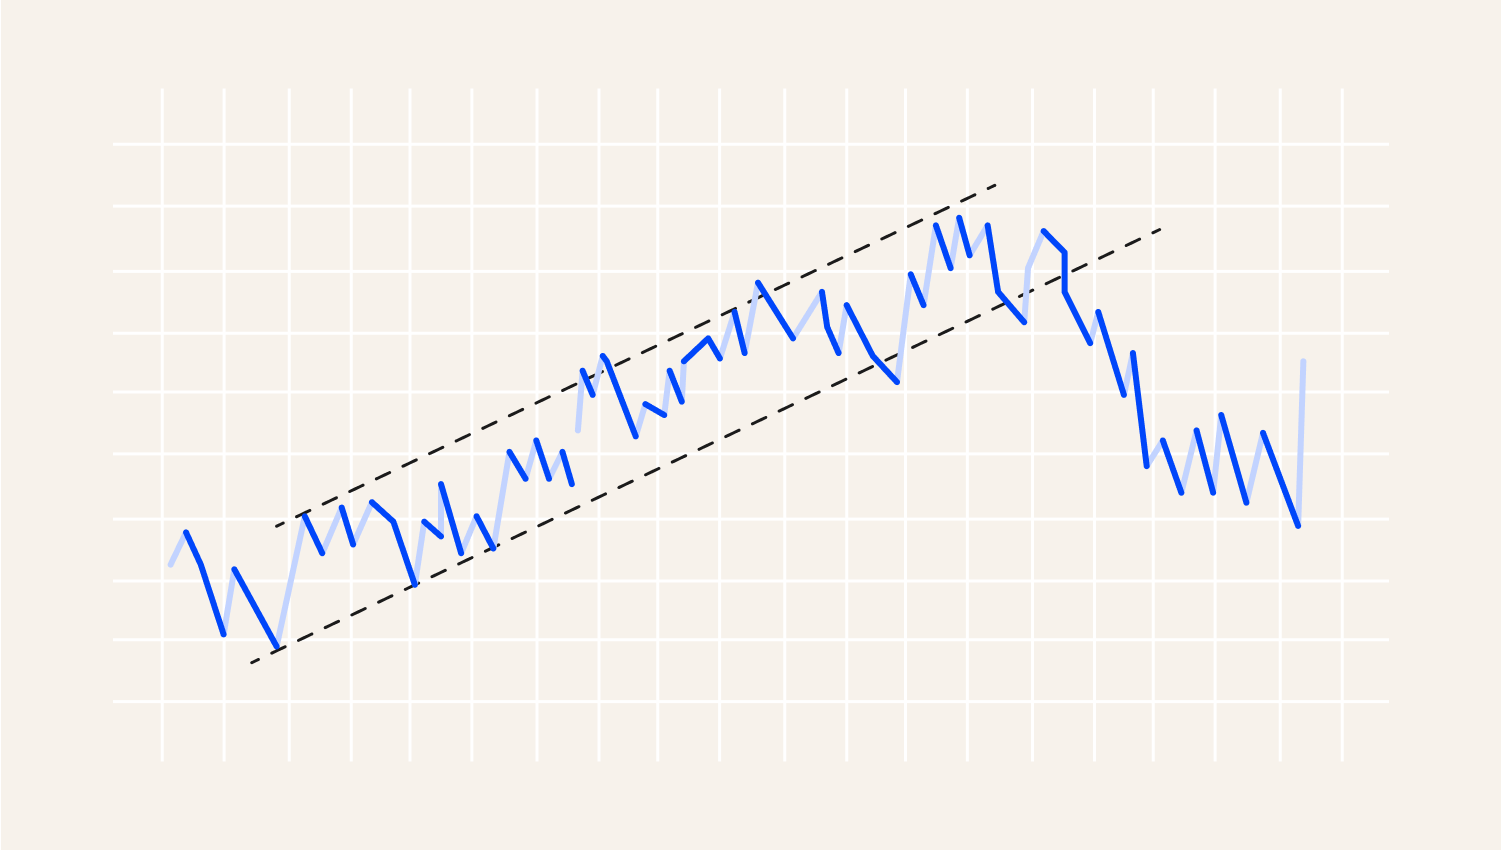
While this strategy can be effective, traders should be prepared for situations where the price breaks through the trend line, as other methods may be needed.
Support and Resistance Strategy
This method is used to identify key price levels where the market tends to reverse. These levels are determined by observing charts and noting where prices hit their highest and lowest points.
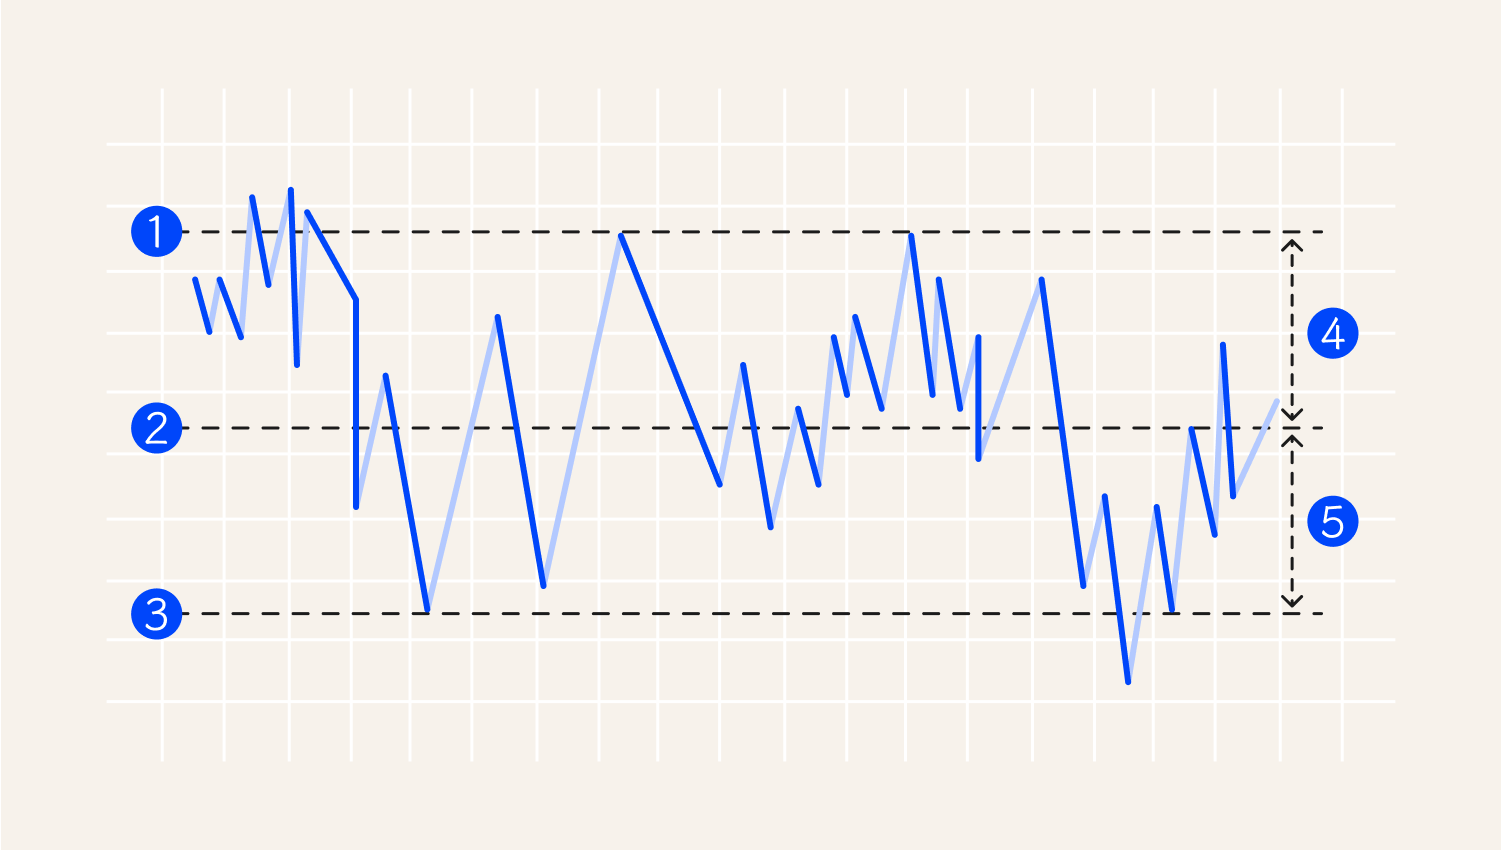
1. Stop loss
2. Entry
3. Profit target
4. Risk
5. Reward
When trading, if the price bounces off the resistance level (the top line), it may then reach the support level (the bottom line). Traders can buy when the price hits support or sell when it touches resistance. Stop-loss orders protect against losses, while take-profit orders secure gains. It's crucial to adjust these levels based on the trading timeframe and be aware of patterns pinpointing potential reversals.
Shooting Star Strategy
It is one of the price action trading strategies that might be applied with any currency pair and timeframe. A Shooting Star candle looks like an upside-down Hammer. It indicates a potential price drop. It forms when buyers push the price up, but sellers take over, leading to a reversal.

1. Rising price
2. Shooting Star
3. Price drop confirmation
4. Declining price
In this strategy, traders focus on selling rather than buying. To sell, wait for the price to close below the Shooting Star's low point. Set a stop loss above the candle's high and aim for profit at support levels. This strategy requires careful observation of price movements after the Shooting Star, which can indicate quick trading opportunities.
The timeframe of the chart is crucial when using the price action strategy. Securities charts differ between different timeframes. For example, a security might have a strong upward trend on a daily chart and a strong downward trend on an hourly chart. One way to avoid a mistake is to consider the type of trader you are. If you are a scalper who benefits from tiny movements, you should use a chart that ranges from 5 minutes to 15 minutes. If you are a day trader who holds trades for a day, your charts should range from 30 minutes to 4 hours. If you are a swing trader who holds a trade for a few days, your charts should range from 1 hour to daily, while if you are a long-term trader, you should focus on daily, weekly, and monthly charts.Caution
Investors who bought stocks at the end of the financial crisis have made money by timing it right. Equally, traders who bought cryptocurrencies in 2017 and shorted them in 2018 have made good money. These examples show the power of price action
in the financial markets. To succeed in it, however, you need to take time to learn and practice using a demo account from your broker.Summary
