Gold Price Forecast: XAU/USD awaits direction after Fed policy inspired-volatility, US Retail Sales eyed
- Gold price still seeks a decisive move despite detailed Fed policy guidance.
- The US Dollar faced pressure as the Fed decided to adopt a calm approach for further policy tightening.
- A decline in the United States Retail Sales data will bolster further inflation softening.
Gold price (XAU/USD) is hovering around $1,810.00 in the early Asian session after displaying volatile moves over the interest rate decision and policy guidance by the Federal Reserve (Fed). The precious metal displayed wild gyrations in a $1.796-1,814 range and has now turned extremely quiet as investors are digesting Fed chair Jerome Powell’s commentary before making an informed decision.
The US Dollar Index (DXY) registered a fresh six-month low at 103.49 as the Fed decided to move forward with a calm approach for further policy tightening. S&P500 settled Wednesday on a bearish note as a higher terminal rate projection by the Fed at 5.1% has triggered a risk of liquidity squeeze from the economy, which may escalate recession risks further. Although, the Fed has provided a diplomatic view on recession citing that "No one knows if we are going to have a recession or not."
Meanwhile, the 10-year US Treasury yields have dropped further to 3.48% as less-hawkish Fed monetary policy has triggered demand for US Treasury bonds. Going forward, investors will keep an eye on United States Retail Sales data, which will release on Thursday. The monthly Retail Sales data (Nov) is expected to contract by 0.1% while the prior release was an expansion by 1.3%. A decline in retail demand will bolster further softening in inflation data.
Gold technical analysis
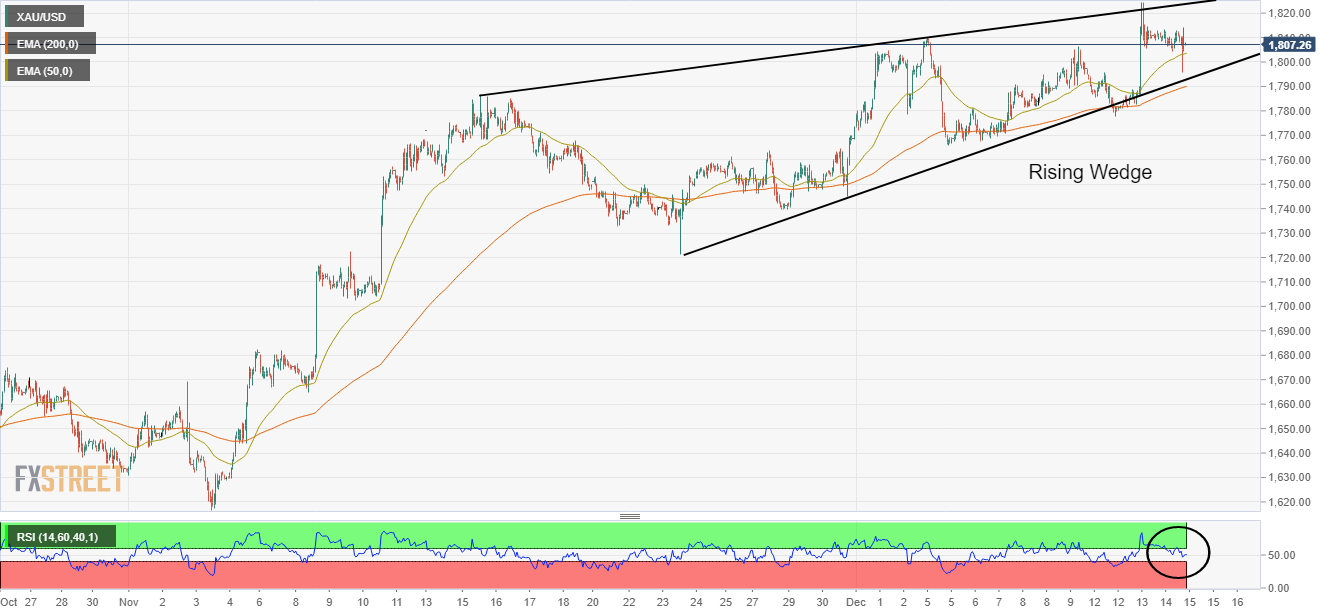
Gold price is auctioning in a Rising Wedge chart pattern on an hourly scale that indicates volatility contraction while reaching near the other end of the tunnel. The 50-and 200-period Exponential Moving Averages (EMAs) at $1.803.67 and $1,790.00 respectively are aiming higher, which adds to the upside filters.
Meanwhile, the Relative Strength Index (RSI) (14) has slipped into the 40.00-60.00 range, which indicates a loss in the upside momentum.
Gold hourly chart