NZD/USD Price Analysis: Retreats towards 0.6300 inside weekly bullish channel
- NZD/USD snaps two-day uptrend as it eases inside a bullish chart formation.
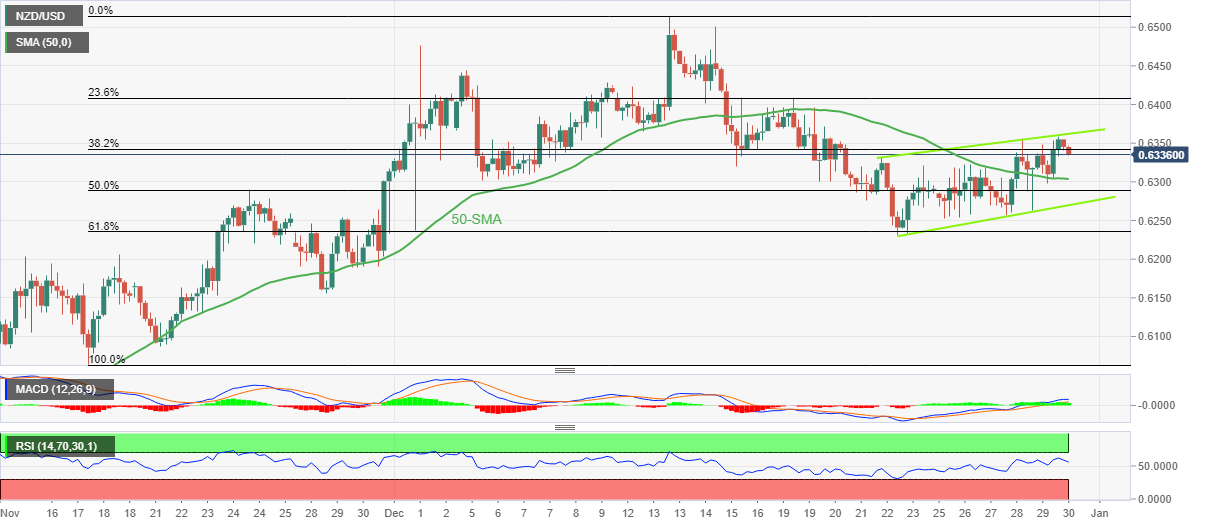
- Bullish MACD signals, firmer RSI keeps buyers hopeful.
- 50-SMA acts as immediate support, monthly low acts as the last defense of bulls.
NZD/USD renews its intraday low near 0.6330 as it pares the recent gains during the last trading day of 2022.
The Kiwi pair rose during the last two consecutive days before reversing from 0.6359. In doing so, the quote took a U-turn from the upper line of a one-week-old ascending trend channel formation.
Although the RSI retreat suggests further consolidation of the NZD/USD gains, the bullish MACD signals could allow the quote to bounce off the 50-SMA support near 0.6300.
In a case where the pair breaks the 0.6300 SMA support, the stated channel’s lower line near 0.6270 will be important to watch afterward. Also acting as the short-term key support is the monthly low which also surrounds the 61.8% Fibonacci retracement level of the November-December upside, near 0.6235.
Should the NZD/USD price drops below 0.6235, the odds of witnessing a slump toward the late November swing low of 0.6155 can’t be ruled out.
On the contrary, the stated channel’s upper line, around 0.6365 by the press time, restricts the immediate advances of the Kiwi pair.
Following that, the 23.6% Fibonacci retracement and the monthly high, respectively around 0.6400 and 0.6500, will be in focus.
Overall, NZD/USD is likely to witness further downside but the room towards the south is limited.
NZD/USD: Four-hour chart
Trend: Limited downside expected