US Dollar Index Price Analysis: DXY remains depressed near 102.70, holds above 23.6% Fibo.
- The USD meets with a fresh supply on Monday and stalls its recovery from over a two-month low.
- Friday’s failure near the 100-day SMA and the 38.2% Fibo. confluence warrants caution for bulls.
- A convincing break below the 102.00 mark is needed to support prospects for additional losses.
The US Dollar (USD) Index (DXY), which tracks the Greenback against a basket of currencies, comes under some selling pressure on the first day of a new week and drops to the daily low, around the 102.70 area in the last hour. The Index, for now, seems to have snapped a two-day winning streak and stalled its recent recovery from the lowest level since May 11 touched last Thursday.
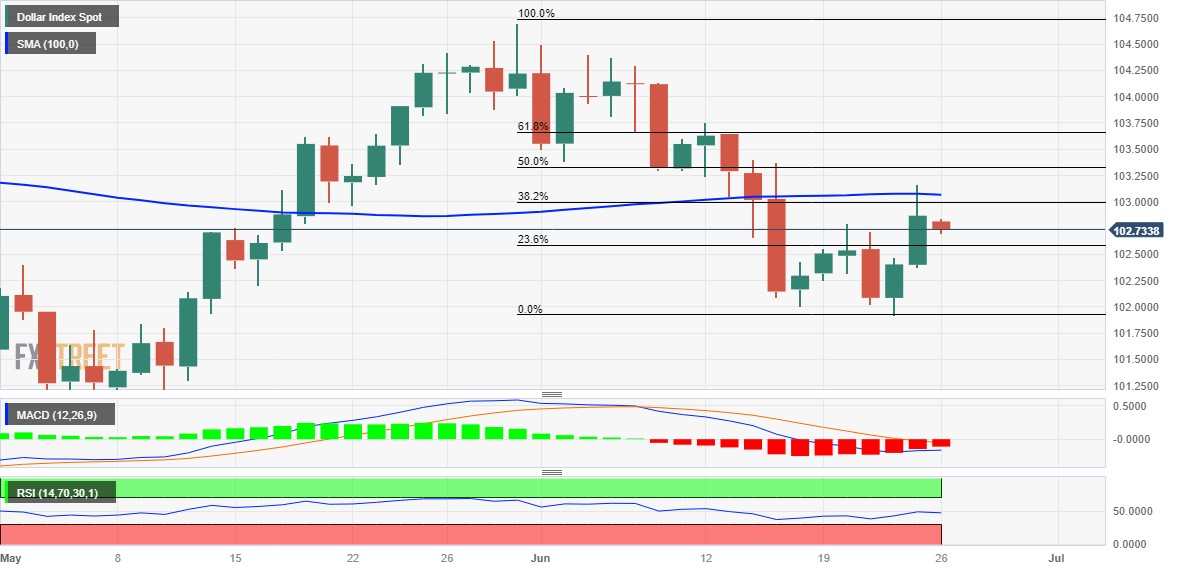
From a technical perspective, the DXY on Friday faced rejection near the 103.05-103.10 confluence hurdle - comprising the 100-day Simple Moving Average (SMA) and the 38.2% Fibonacci retracement level of the downfall from the May swing high. The said barrier should now act as a pivotal point, which if cleared decisively could trigger a fresh bout of a short-covering move and pave the way for some meaningful appreciating move.
The DXY might then aim to surpass the 50% Fibo. level, around the 103.35 region, and climb to the 103.65-103.70 resistance zone, over the 61.8% Fibo. level. Some follow-through buying will shift the bias back in favour of bullish traders and allow the index to reclaim the 104.00 mark. The momentum could get extended further towards the 104.40 supply zone en route to the 104.70 area, or a nearly three-month peak touched on May 31.
On the flip side, sustained weakness below the 23.6% Fibo. level, around the 102.60-102.55 region, will expose the 102.15-102.10 horizontal support. This is followed by the monthly low, just below the 102.00 mark, below which the DXY could accelerate the fall towards testing the next relevant support near the 101.30-101.25 region. The index could eventually drop to the 101.00 mark en route to the 100.80-100.75 area, or the April swing low.
US Dollar Index (DXY) daily chart
Key levels to watch