NZD/USD Price Analysis: Pairs fail to hold 0.6070,bears take the lead
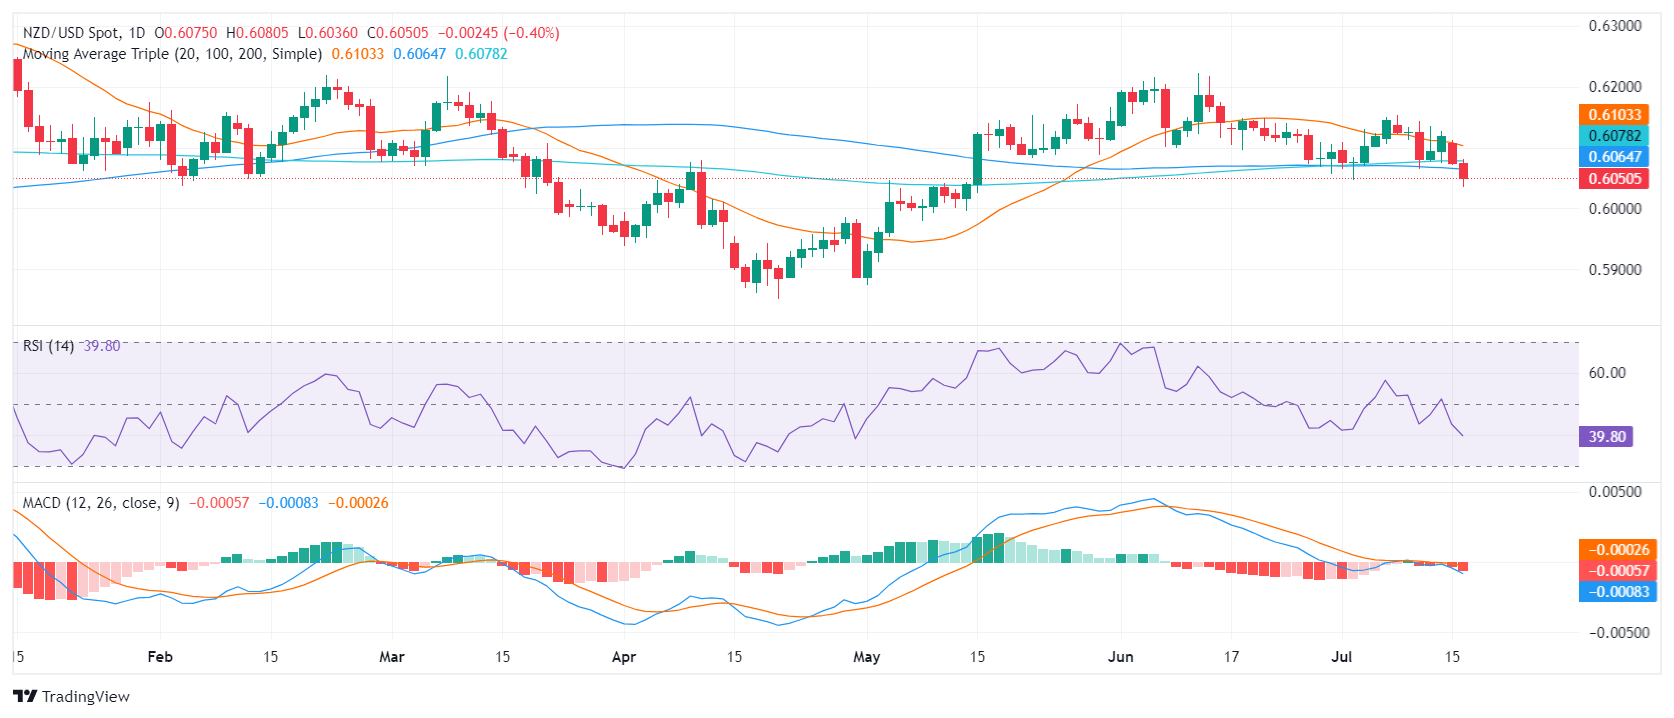
- NZD/USD fails to preserve the 0.6070 level, plunging to lows seen in mid-May.
- Pairs are now trading below the critical 20, 100, and 200-day SMA lines, suggesting a bearish outlook.
- Daily indicators emphasize a mounting selling pressure.
In Tuesday's session, the NZD/USD declined by 0.40% to reach 0.6052 levels. Buyers failed to hold the 0.6070 mark, causing the pair to hit mid-May lows. Notably, the NZD/USD is now below the important Simple Moving Averages (SMA) of 20, 100, and 200 days, indicating a bearish outlook.
Daily technical indicators present a stronger bearish picture. The Relative Strength Index (RSI) stands at 38 after being above 50 last week. Meanwhile, the Moving Average Convergence Divergence (MACD) shows rising red bars, implying an increasing bearish momentum.
NZD/USD daily chart

Resistance can now be found at the previous support of 0.6070, followed by the 20-day SMA around 0.6100 and then at 0.6150 and above at 0.6200. Bulls need a decisive close above these levels for a bullish turnaround and to shift the focus upwards.
The downside has a firm support at 0.6050 and then at 0.6030 and adjusting to the bearish shift, a key psychological mark at 0.6000 floats into view. A significant plunge below these levels would confirm the bearish outlook, potentially setting a path for a correction toward lower ranges.
