AUD/USD Review: Greenback bounce capping off the Aussie's rise
- Aussie on a bullish stance, but hesitating near recent highs as the US Dollar begins to gain on the day.
- China CPI/PPI figures today couldn't push the Aussie higher as the Australian NAB surveys failed to expand.
The AUD/USD is sifting backwards into 0.7460 after climbing through the early Asia session, marking in a high of 0.7483, but a rebound in the Dollar index is seeing the Aussie taking a step back as the USD steps up in quiet Tuesday trading.
The Aussie was bolstered into a bullish stance by rising copper prices to kick off the trading week, and combined with a softening in the USD to take the AUD/USD into fresh weekly highs, but the Dollar is seeing a brief resurgence for Tuesday and the pair is stooping from the week's current highs near 0.7500.
The AUD began to waffle against the USD after China's y/y CPI came in at expectations, printing at 1.9%, while the y/y PPI came in better than expected at 4.7%; however, the Aussie NAB Business Confidence and Conditions surveys came in below expectations, with the confidence survey printing at 15 versus the expected 18, and the conditions survey coming in at 6 versus the forecast 8. Both indicators were expected to improve, but results showed a lack of upward movement and they remained steady at their previous readings.
AUD/USD Technical Analysis
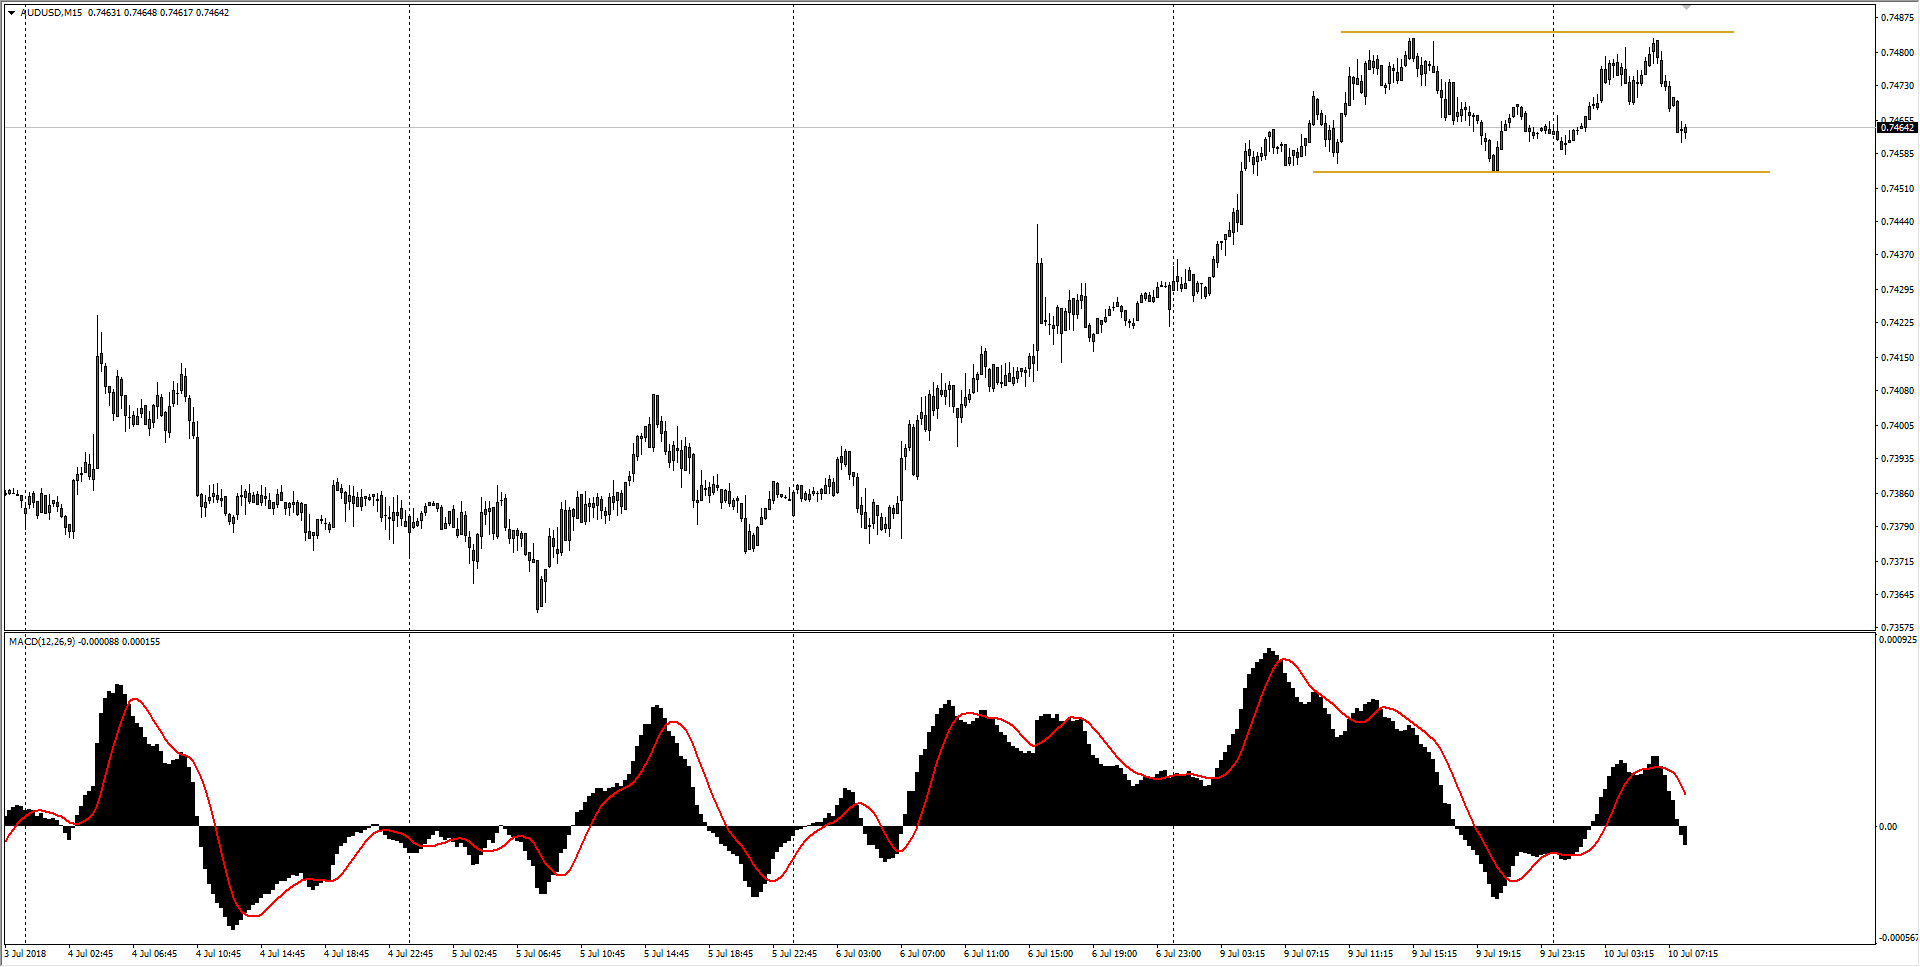
Hourly charts show the AUD/USD could be forming a double-top reversal pattern, with neckline support from 0.7456, though the hourly Relative Strength Index has diverged, turning to favor the bears.
| Spot rate: | 0.7464 |
| Relative change: | 0.47% |
| High: | 0.7483 |
| Low: | 0.7427 |
| Trend: | Bullish |
| Support 1: | 0.7495 (50 day MA) |
| Support 2: | 0.7537 (61.8% Fibo retracement level) |
| Support 3: | 0.7605 (May 22nd swing high) |
| Resistance 1: | 0.7456 (double-top neckline) |
| Resistance 2: | 0.7426 (5-day MA) |
| Resistance 3: | 0.7394 (10-day MA) |
AUD/USD Chart, 15-Minute