Gold Technical Analysis: Bears await a convincing break through an ascending trend-line support
• The precious metal has managed to defend a short-term ascending trend-line support on the 1-hourly chart, albeit has struggled to gain any meaningful traction.
• The commodity's inability to recover back above the key $1200 psychological mark, despite reviving safe-haven demand, increases prospects for a bearish breakdown.
• Moreover, technical indicators on the mentioned chart have already drifted into negative territory and add credence to the near-term negative outlook.
• However, it would be prudent to wait for a convincing break through the mentioned trend-line support before positioning for any further depreciating move.
Gold 1-hourly chart
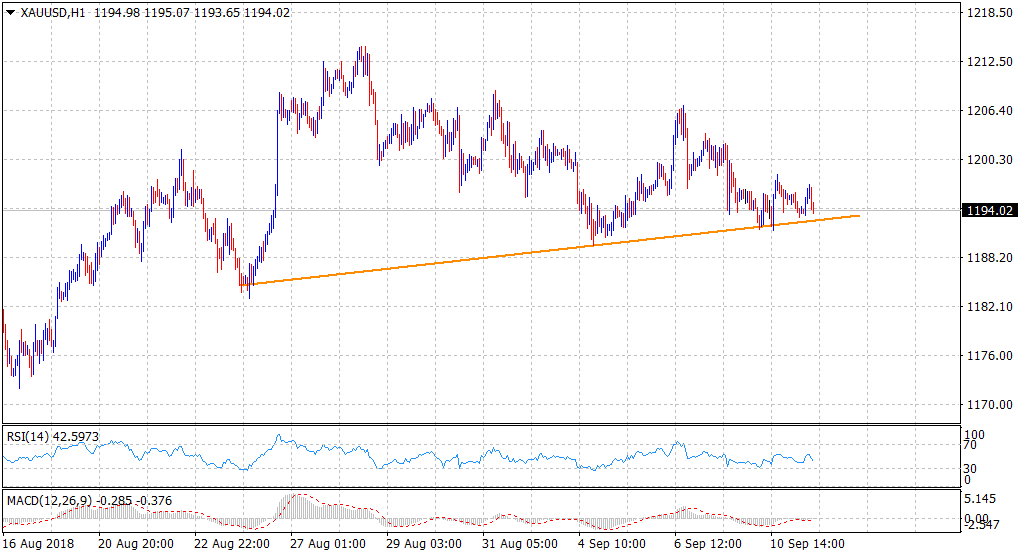
Spot Rate: $1194.02
Daily High: $1197.19
Trend: Bearish below trend-line support
Resistance
R1: $1197.19 (current day swing high)
R2: $1200 (round figure mark)
R3: $1204.62 (50-day SMA)
Support
S1: $1291.57 (overnight swing low)
S2: $1287.62 (S2 daily pivot-point)
S3: $1280 (horizontal zone)