US Dollar Index Technical Analysis: Rising wedge can send DXY down to 97.00 figure
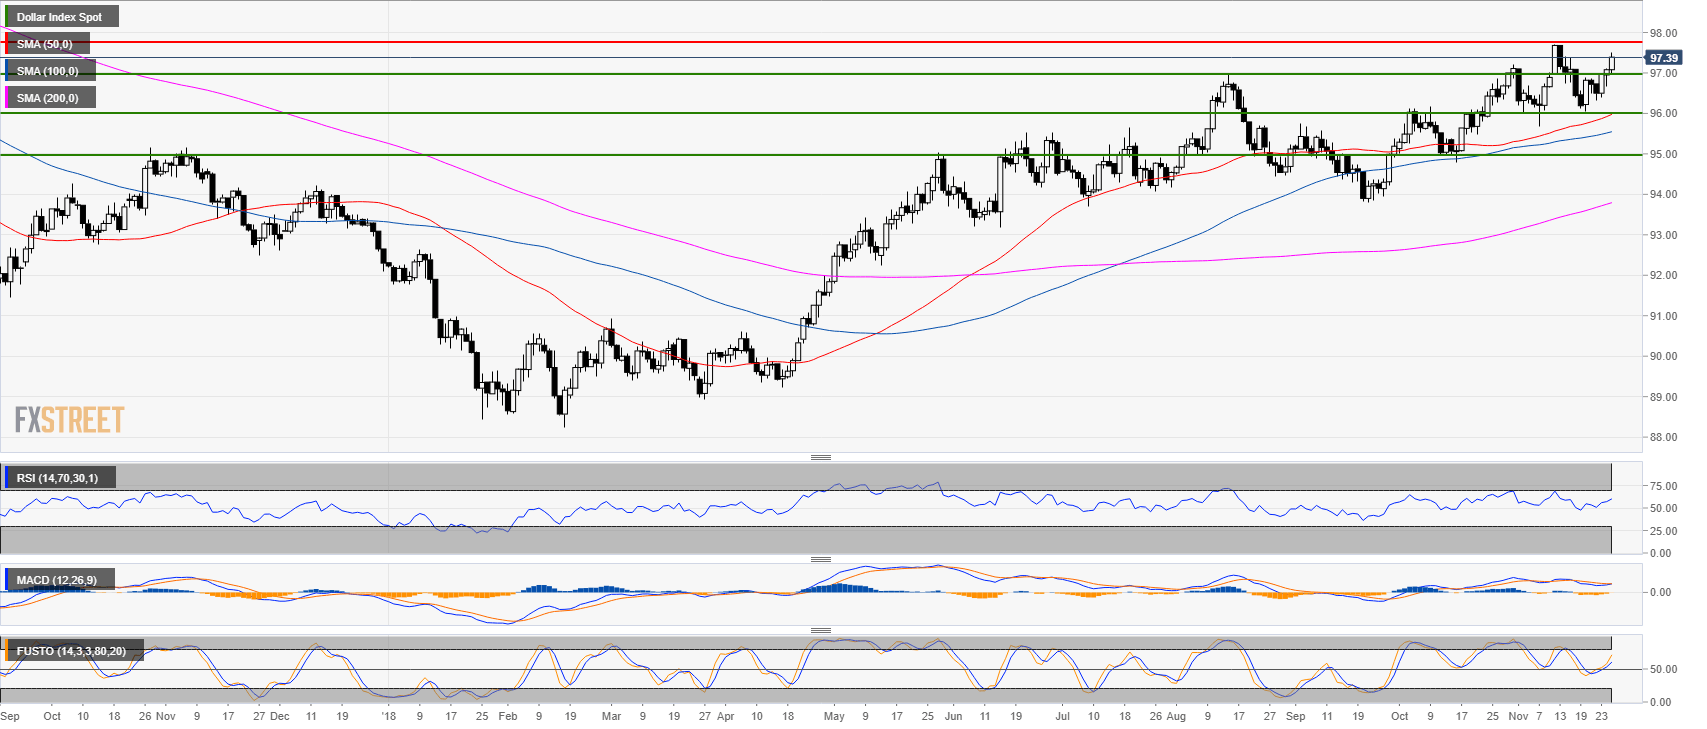
US Dollar Index (DXY) daily chart
- DXY is trading in a bull trend above the 50, 100 and 200-day simple moving averages (SMAs).
- DXY broke above the 97.00 figure as bulls are targeting the 2018 high.
- The RSI, MACD and Stochastic indicators are bullishly configured.

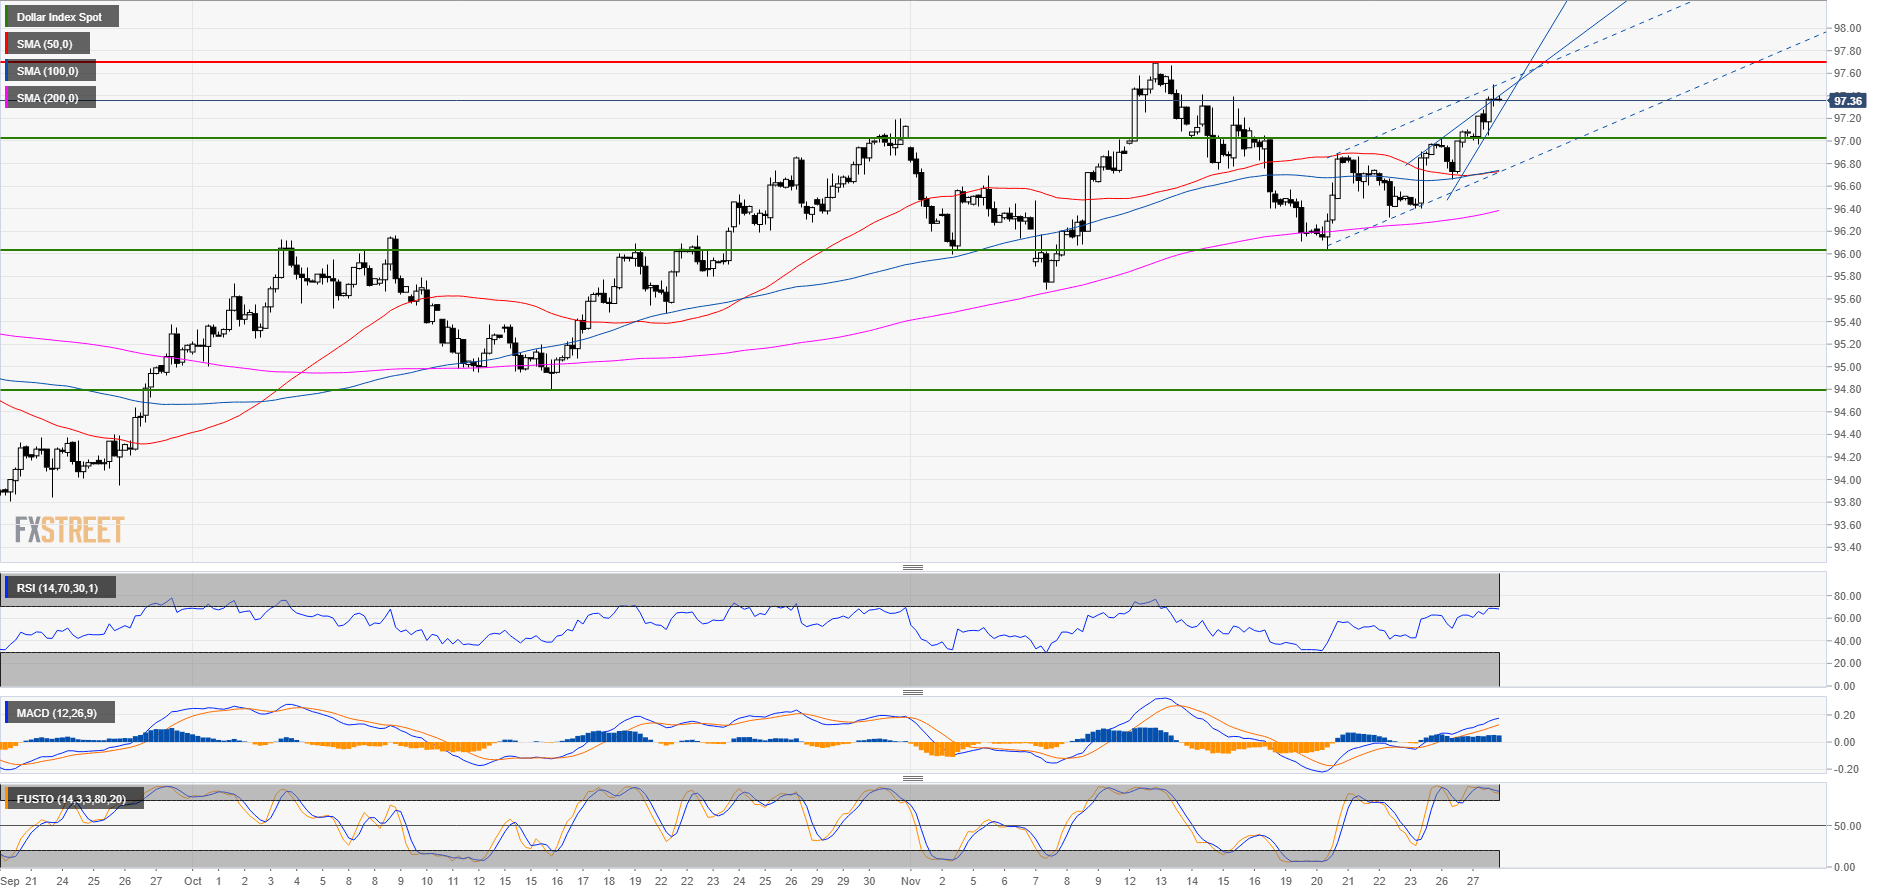
DXY 4-hour chart
- DXY is a the top of a bullish channel while the market formed a rising wedge. While a spike to 97.70 (2018 high) can still potentially be on the cards, the current market structure suggests a bullish exhaustion in the coming sessions.
- The RSI and MACD are bullishly configured while the Stochastic indicator is in the overbought zone.
- A failure below the 2018 high would likely see a retest of the 97.00 figure.

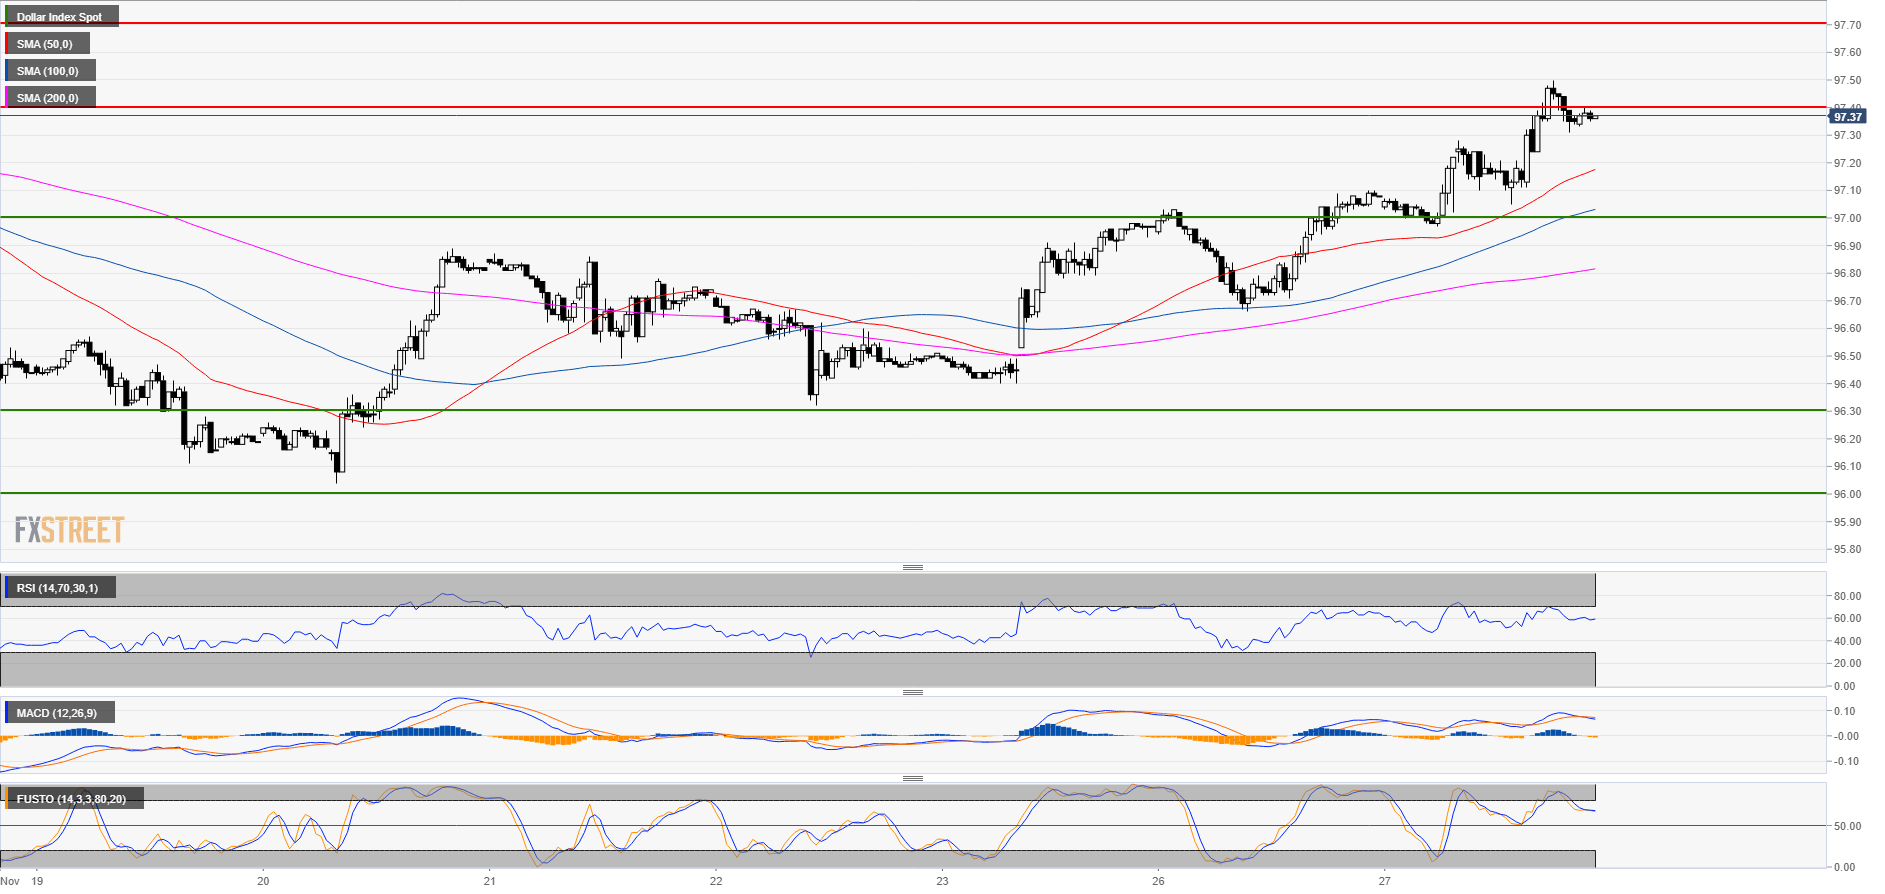
DXY 30-minute chart
- The lower time-frames are still quite bullish with DXY above the 50, 100 and 200 SMAs.

Additional key levels
Dollar Index Spot
Overview:
Today Last Price: 97.36
Today Daily change: 28 pips
Today Daily change %: 0.288%
Today Daily Open: 97.08
Trends:
Previous Daily SMA20: 96.75
Previous Daily SMA50: 95.92
Previous Daily SMA100: 95.52
Previous Daily SMA200: 93.76
Levels:
Previous Daily High: 97.1
Previous Daily Low: 96.66
Previous Weekly High: 96.98
Previous Weekly Low: 96.04
Previous Monthly High: 97.2
Previous Monthly Low: 94.79
Previous Daily Fibonacci 38.2%: 96.93
Previous Daily Fibonacci 61.8%: 96.83
Previous Daily Pivot Point S1: 96.79
Previous Daily Pivot Point S2: 96.51
Previous Daily Pivot Point S3: 96.35
Previous Daily Pivot Point R1: 97.23
Previous Daily Pivot Point R2: 97.39
Previous Daily Pivot Point R3: 97.67
