USD/CAD Technical Analysis: Greenback reaches new 5-month's high against the Canadian Dollar en route to 1.3400 figure
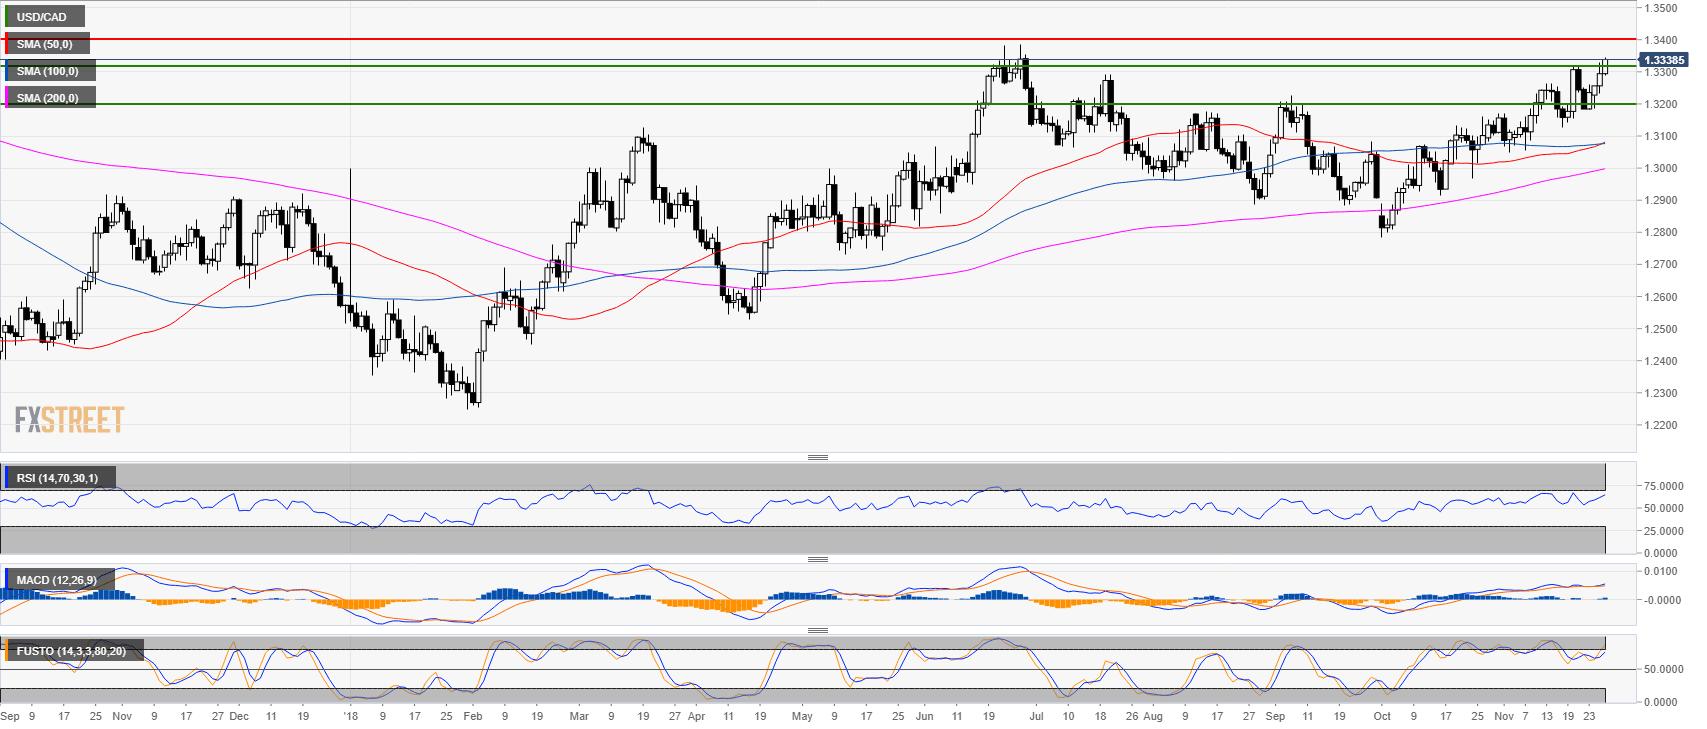
USD/CAD daily chart
- USD/CAD is trading in a bull trend above the 50, 100 and 200-period simple moving averages (SMAs).
- USD/CAD bulls want to test the 1.3400 figure.
- Technical indicators are in positive territories.
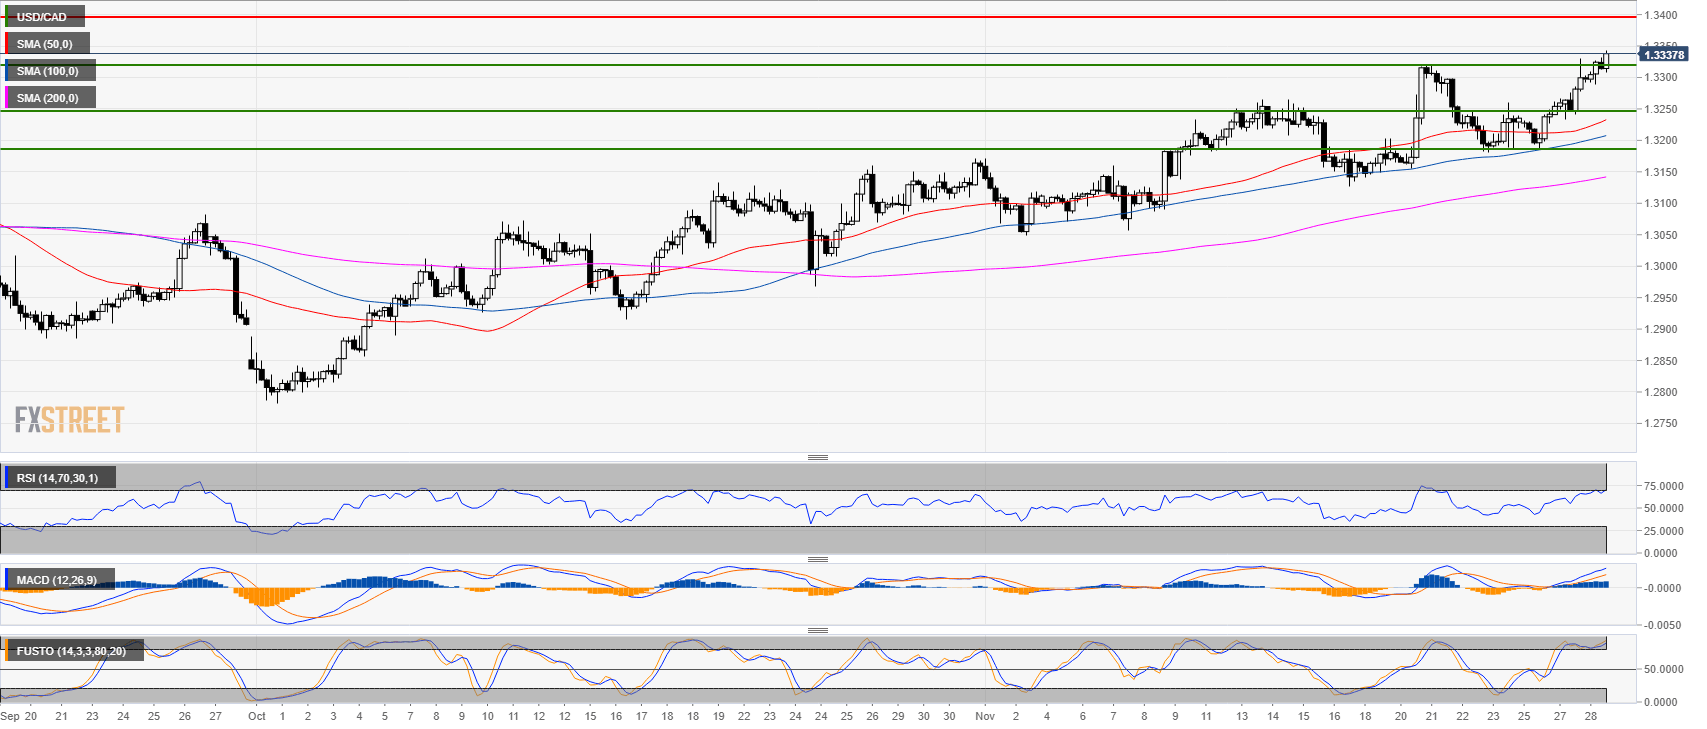
USD/CAD 4-hour chart
- USD/CAD bulls next objective is to break above 1.3219 on a daily closing basis to reach 1.3400 figure in the next sessions.
- Failure to hold the market above 1.3300 can lead to a pullback down to 1.3250 support.
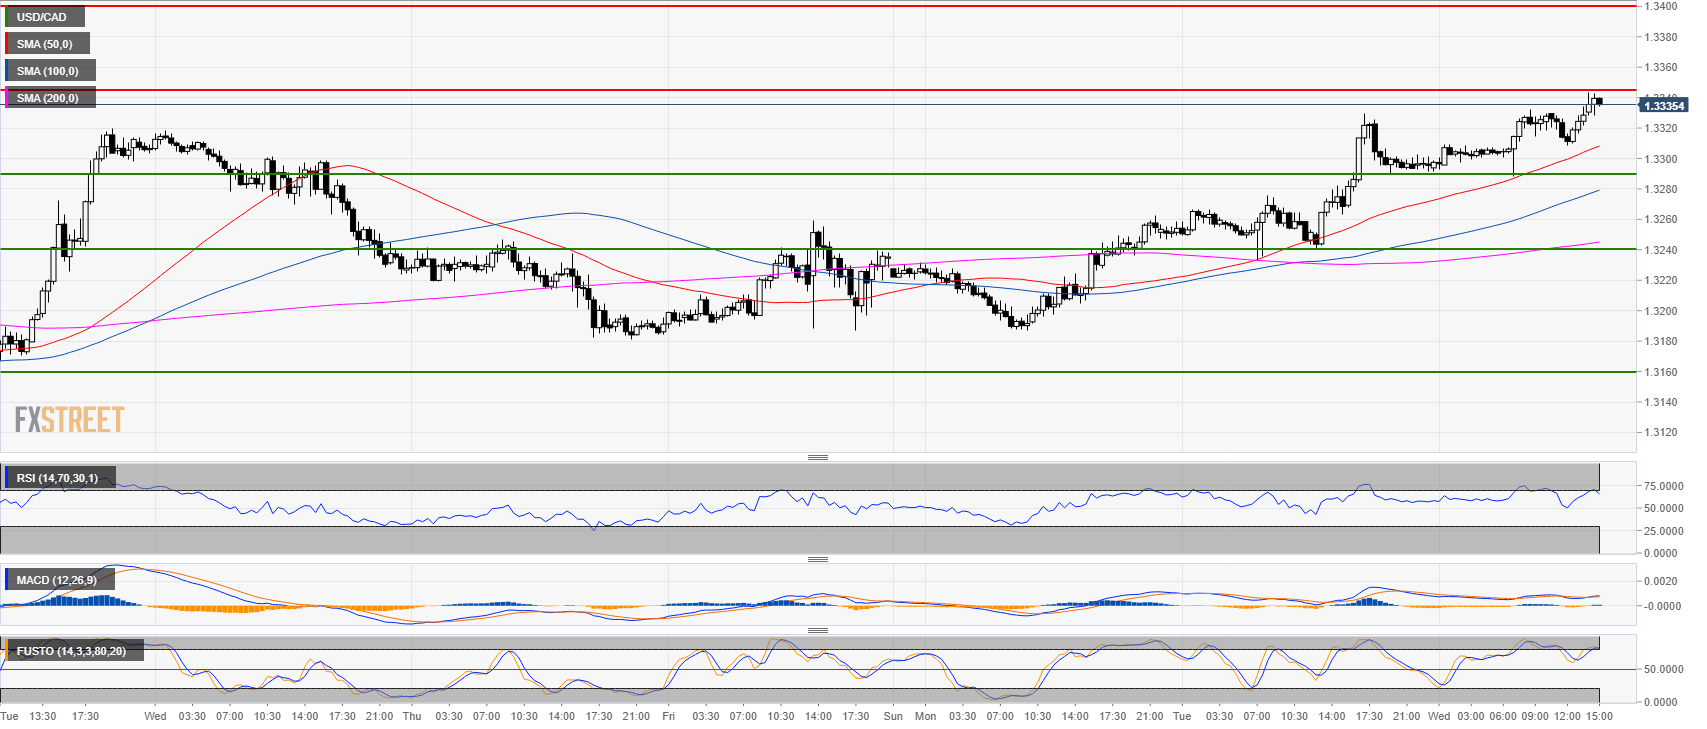
USD/CAD 30-minute chart
- USD/CAD is continuing to move up for the fourth day in a row as it is trading above its SMAs.
Additional key levels
USD/CAD
Overview:
Today Last Price: 1.334
Today Daily change: 46 pips
Today Daily change %: 0.346%
Today Daily Open: 1.3294
Trends:
Previous Daily SMA20: 1.3191
Previous Daily SMA50: 1.3073
Previous Daily SMA100: 1.3075
Previous Daily SMA200: 1.299
Levels:
Previous Daily High: 1.333
Previous Daily Low: 1.3234
Previous Weekly High: 1.332
Previous Weekly Low: 1.3142
Previous Monthly High: 1.3172
Previous Monthly Low: 1.2783
Previous Daily Fibonacci 38.2%: 1.3293
Previous Daily Fibonacci 61.8%: 1.327
Previous Daily Pivot Point S1: 1.3242
Previous Daily Pivot Point S2: 1.319
Previous Daily Pivot Point S3: 1.3146
Previous Daily Pivot Point R1: 1.3338
Previous Daily Pivot Point R2: 1.3382
Previous Daily Pivot Point R3: 1.3434