Back
20 Feb 2019
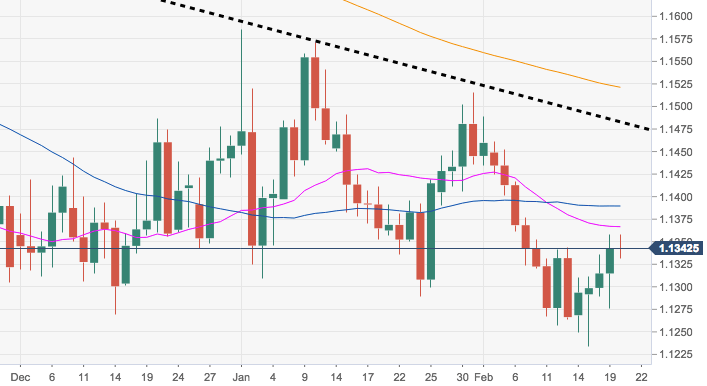
EUR/USD Technical Analysis: Spot erodes the Fibo retracement in the mid-1.1300s
- EUR/USD keeps trading on a positive note so far this week and is now challenging the 1.1350/55 band, where emerges a Fibo retracement of the September-November drop.
- The pair needs to regain the 100-day SMA in the 1.1400 neighbourhood in order to alleviate downside pressure, although the bearish view is poised to persist while below the short-term resistance line at 1.1482.
- In case the offered bias resumes, the 10-day SMA at 1.1309 emerges as the initial support ahead of YTD lows in the 1.1235/30 band.
EUR/USD daily chart
EUR/USD
Overview:
Today Last Price: 1.1344
Today Daily change: 24 pips
Today Daily change %: 0.01%
Today Daily Open: 1.1343
Trends:
Daily SMA20: 1.1368
Daily SMA50: 1.1392
Daily SMA100: 1.14
Daily SMA200: 1.1524
Levels:
Previous Daily High: 1.1358
Previous Daily Low: 1.1276
Previous Weekly High: 1.1344
Previous Weekly Low: 1.1234
Previous Monthly High: 1.1586
Previous Monthly Low: 1.1289
Daily Fibonacci 38.2%: 1.1327
Daily Fibonacci 61.8%: 1.1307
Daily Pivot Point S1: 1.1293
Daily Pivot Point S2: 1.1243
Daily Pivot Point S3: 1.121
Daily Pivot Point R1: 1.1376
Daily Pivot Point R2: 1.1409
Daily Pivot Point R3: 1.1459