Back
25 Apr 2019
USD/CAD Technical Analysis: Greenback bulls knocking at the 1.3420 resistance
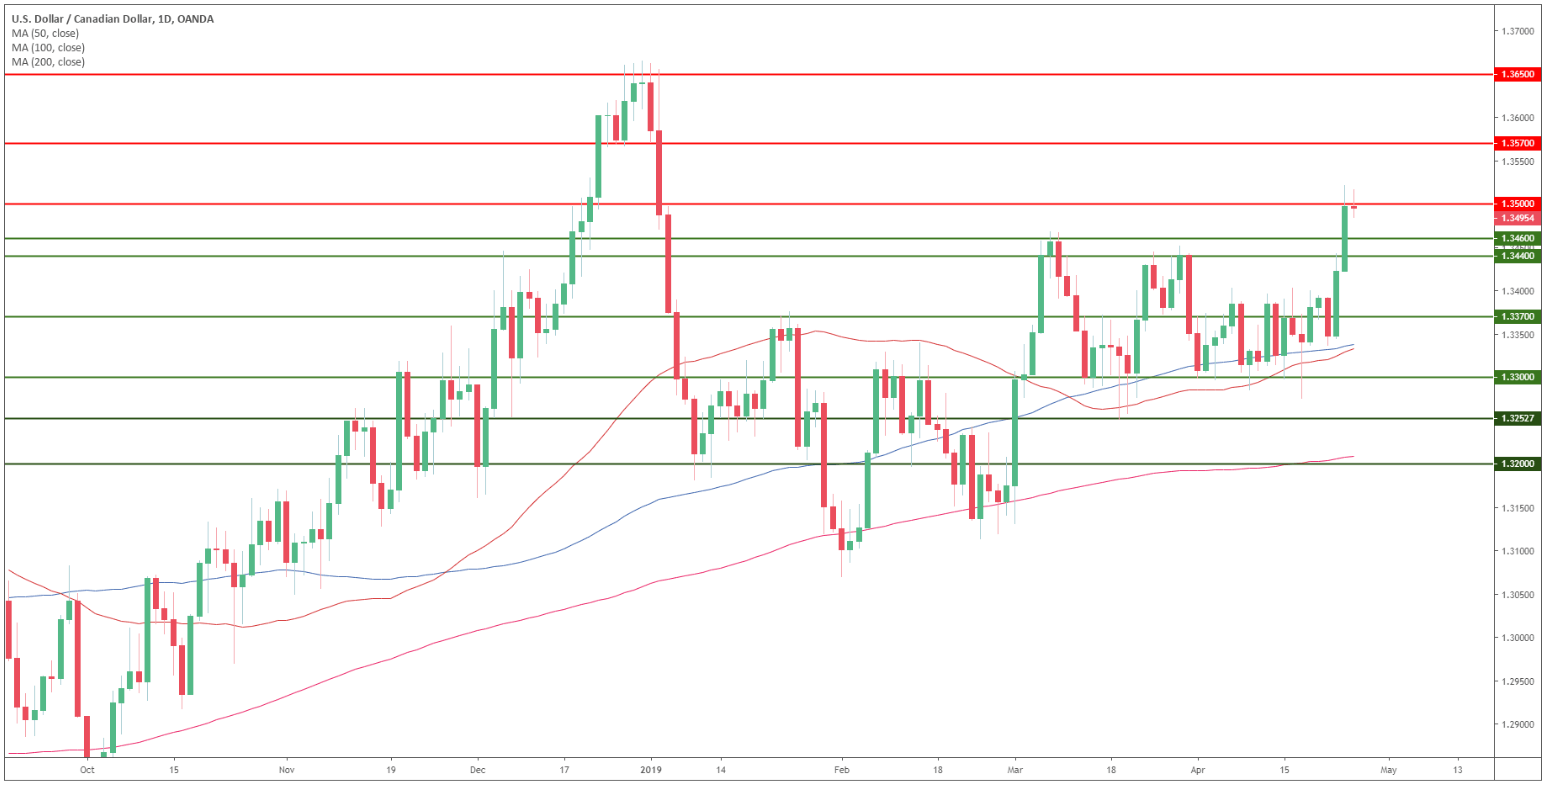
USD/CAD daily chart
- USD/CAD is trading in a bull trend above its 200 simple moving average (SMA).
- USD/CAD is currently trading inside Wednesday’s range unable to move beyond the 1.3500 figure for now.
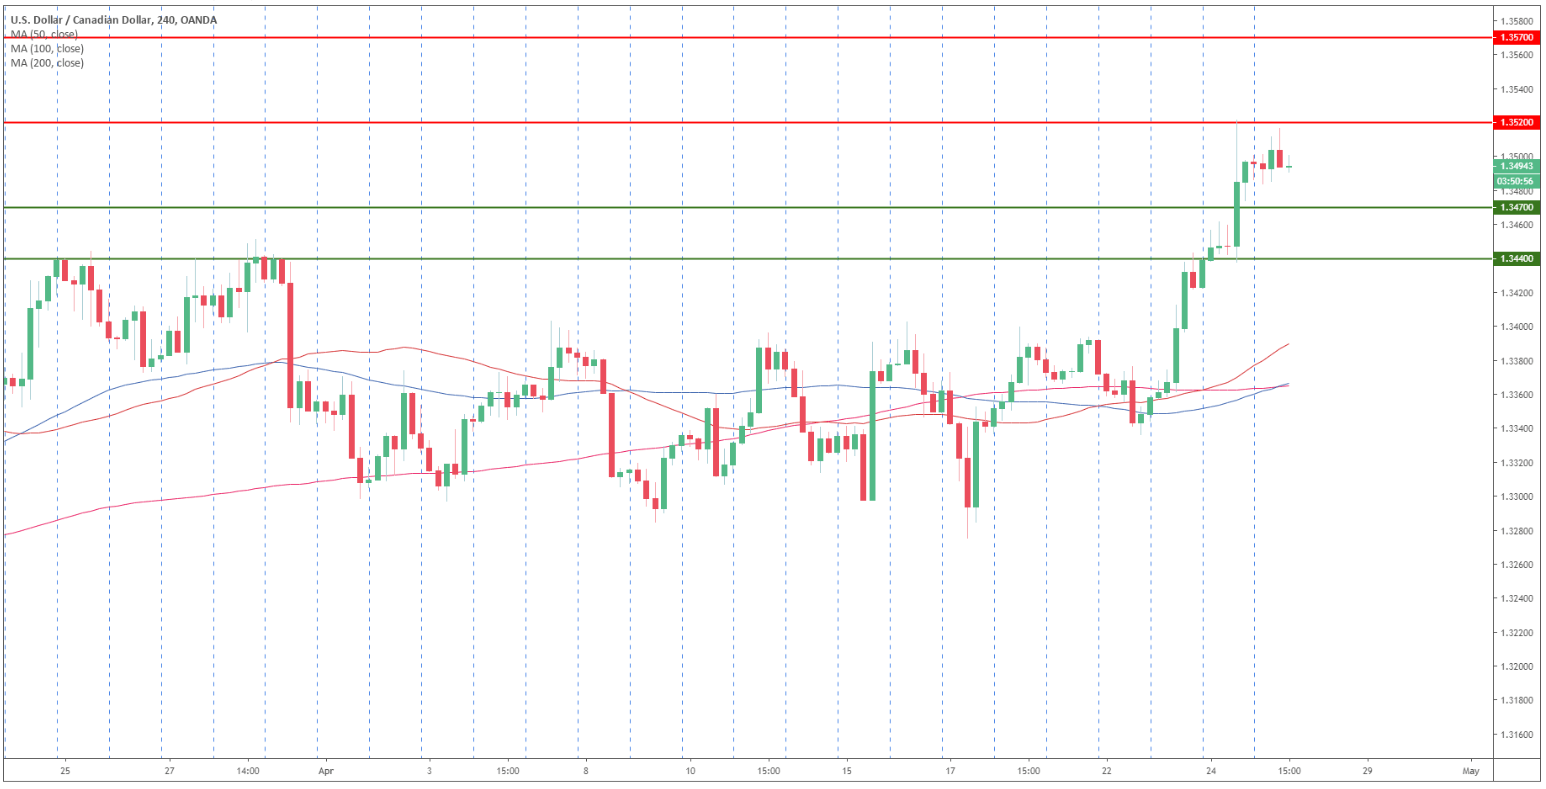
USD/CAD 4-hour chart
- 1.3520 become the level to beat for bulls. A break above the resistance can lead to an extension of the bull move to 1.3570 resistance.
- Alternatively, a correction down can see 1.3470 and 1.3400 figure put to the test.
Additional key levels