Back
13 May 2019
EUR/USD technical analysis: Bulls running out of breath as 1.1260 caps prices - All downhill now ?
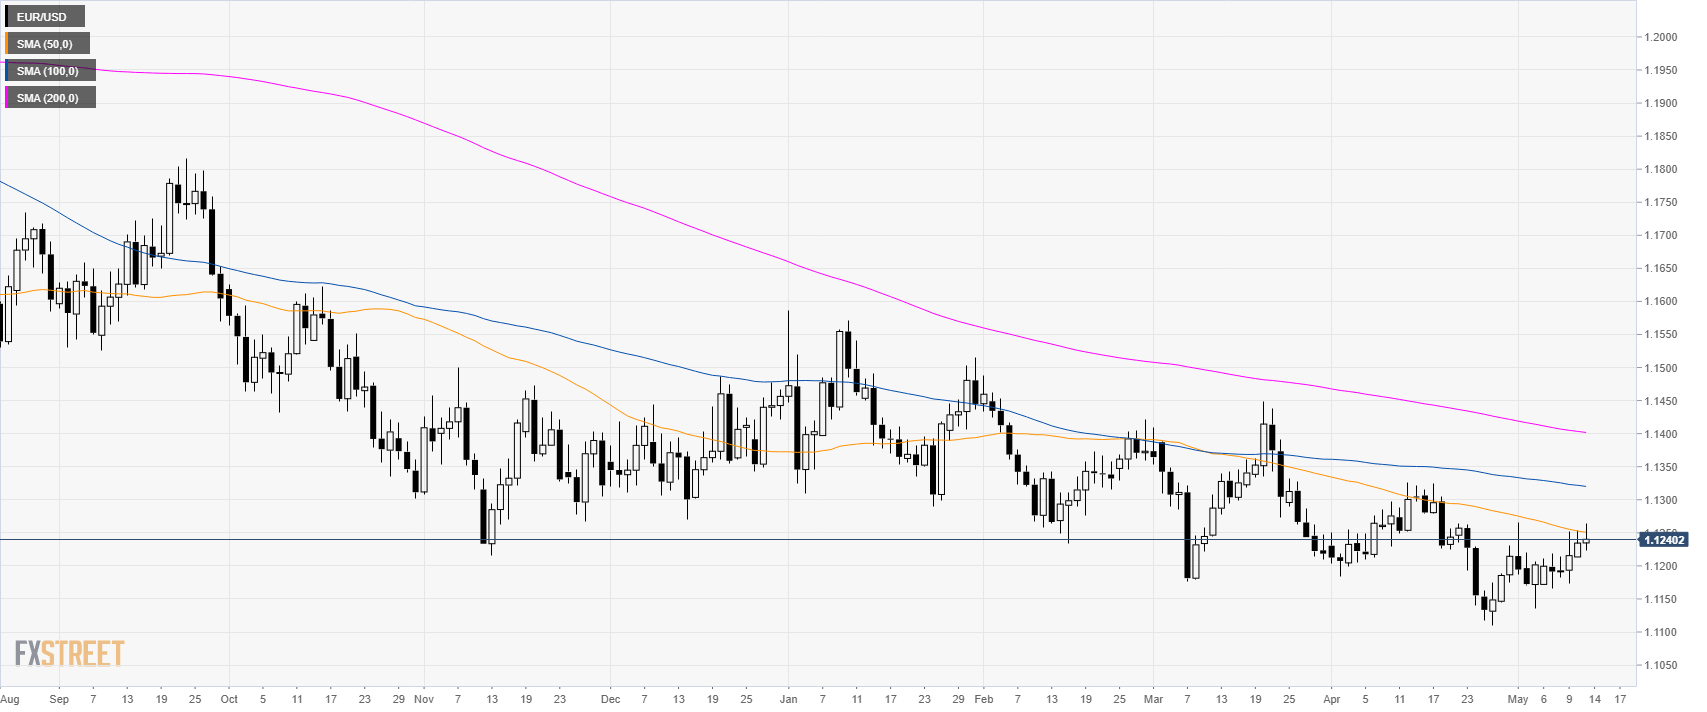
EUR/USD daily chart
EUR/USD is trading in a bear trend below its main simple moving averages (SMAs). The market is rejecting the 50 SMA near the 1.1250 level.
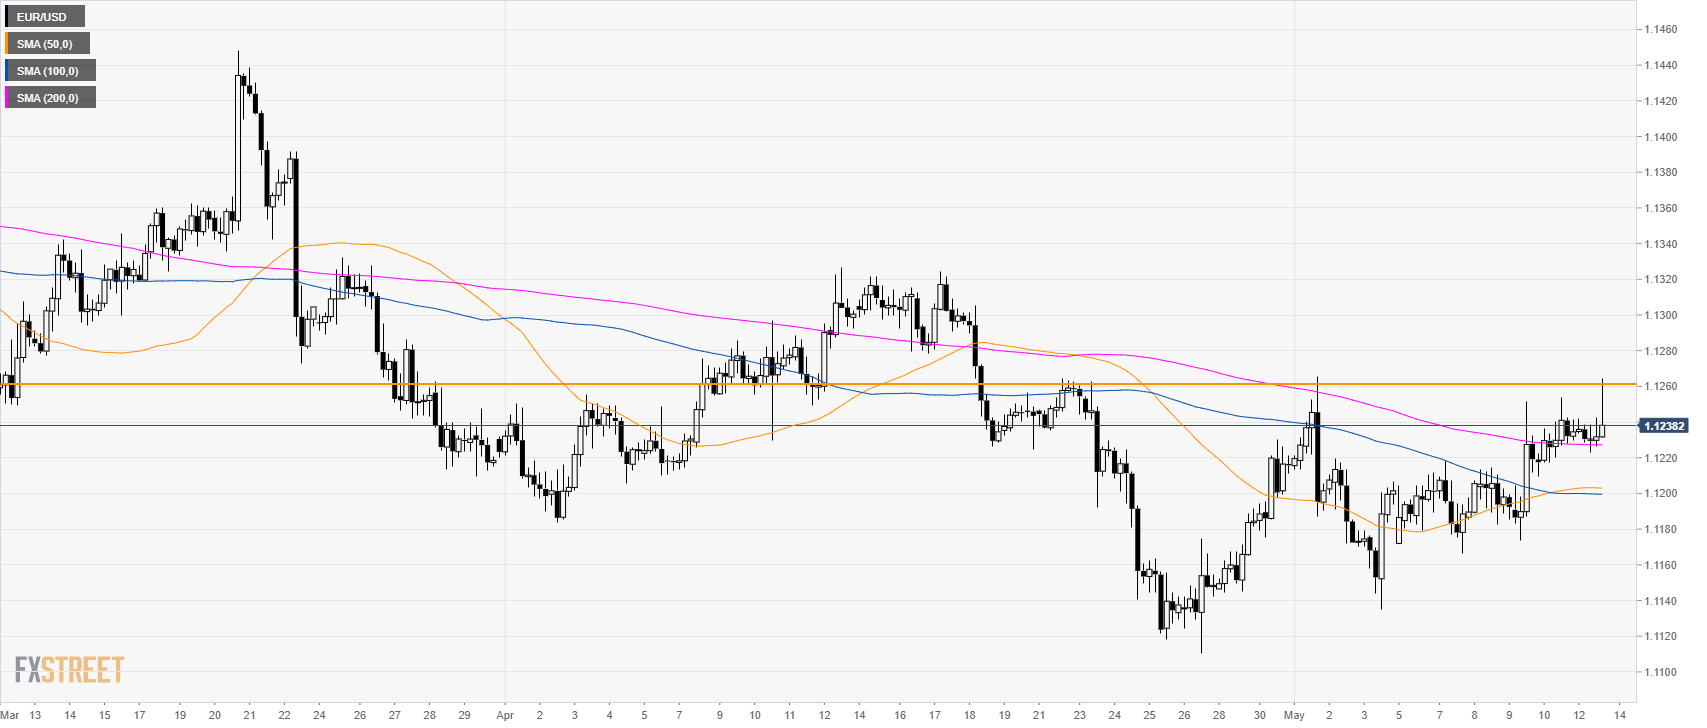
EUR/USD 4-hour chart
The market is finding no acceptance above 1.1260 resistances as EUR/USD is trading above its main SMAs.
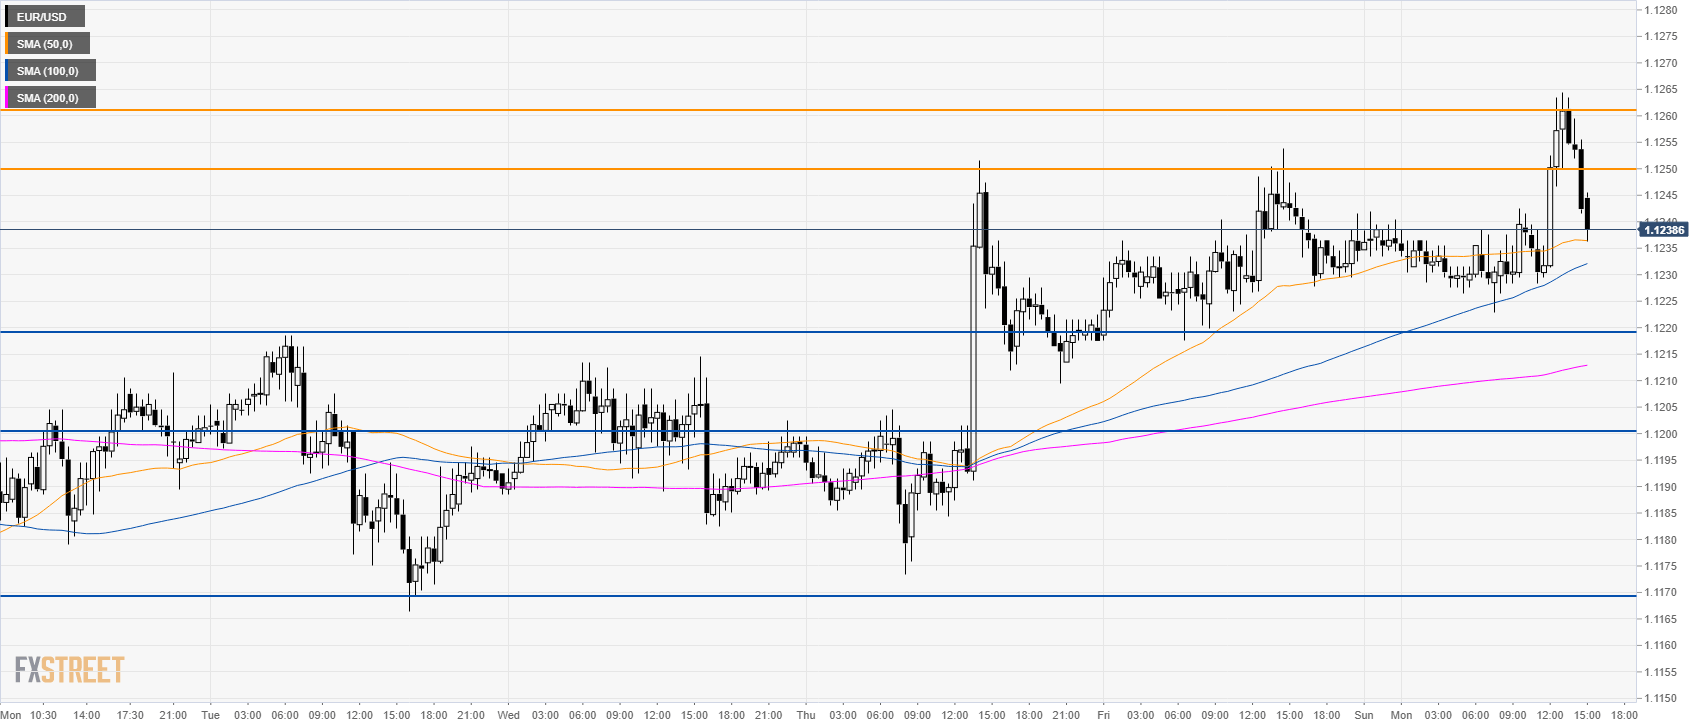
EUR/USD 30-minute chart
The current failure to break above 1.1260 can see 1.1220, 1.1200 support revisited.
If the market breaks 1.1260 on a daily closing basis the bulls might recapture 1.1300 figure.
Additional key levels