Back
19 Jun 2019
EUR/USD technical analysis: Euro rises near 1.1257 resistance on dovish Fed message
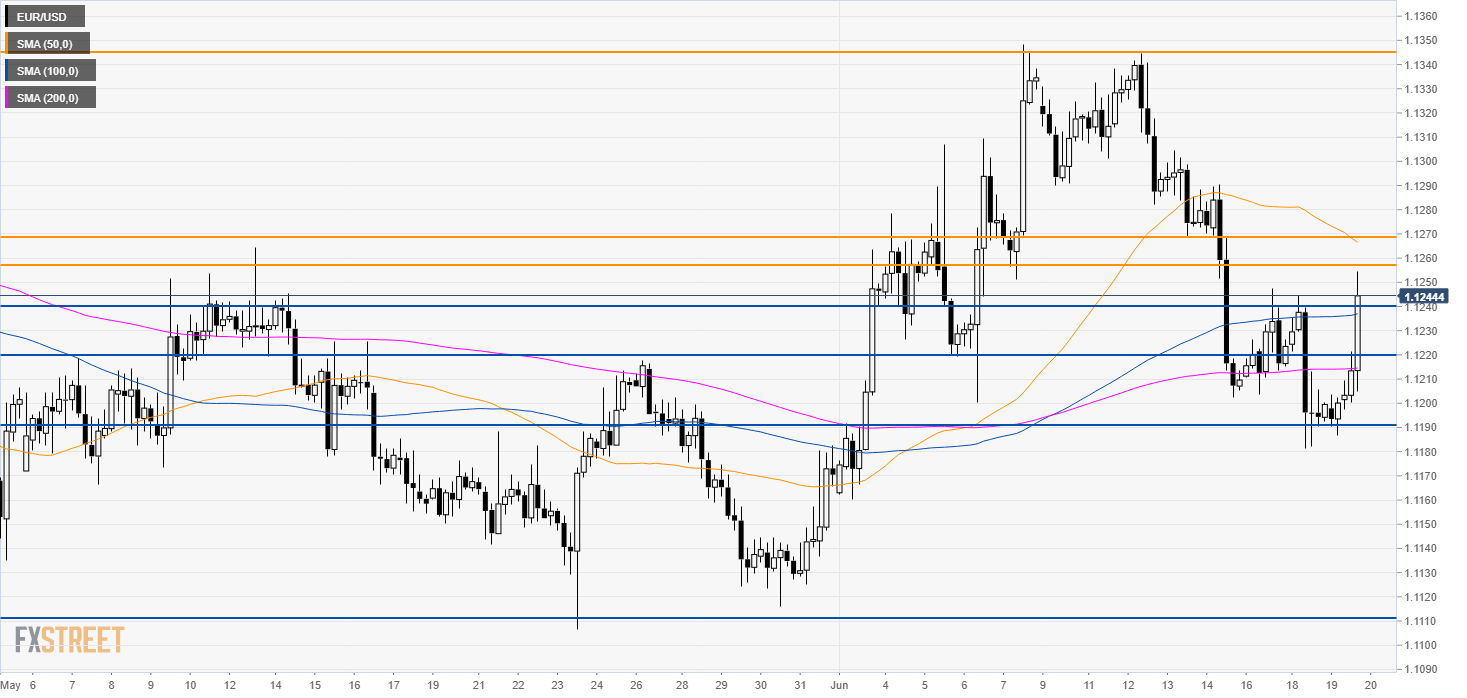
- EUR/USD rises to new weekly highs almost reaching 1.1257 resistance.
- If 1.1257 resistance is broken the next main bull target can be seen at 1.1344.
The US Dollar is weakening across the board as the Fed is hinting at cutting rates.
EUR/USD daily chart
EUR/USD is trading in a bear trend below its 100 and 200 simple moving average (DSMA). The market trades above the 1.1200 figure its 50 SMA still trapped in the range of the last 3 days.

EUR/USD 4-hour chart
The market broke above 1.1240 and almost reached 1.1257 (Monthly Pivot Point R1).

EUR/USD 30-minute chart
EUR/USD is trading above its main SMAs suggesting bullish momentum in the medium term. The level to beat for bulls become 1.1257 to get to 1.1268 which seems the last bastion of resistance before 1.1344 (previous week high and monthly Pivot Point Resistance 2), according to the Technical Confluence Indicator. Support levels are seen at 1.1220 and 1.1190.
Additional key levels
