Back
22 Jul 2019
Oil technical analysis: WTI consolidates heavy losses below $57.00 a barrel
- Oil is in consolidation mode between the 56.00 and 57.00 level.
- The level to beat for bears are seen at 56.00 and $55.00 a barrel.
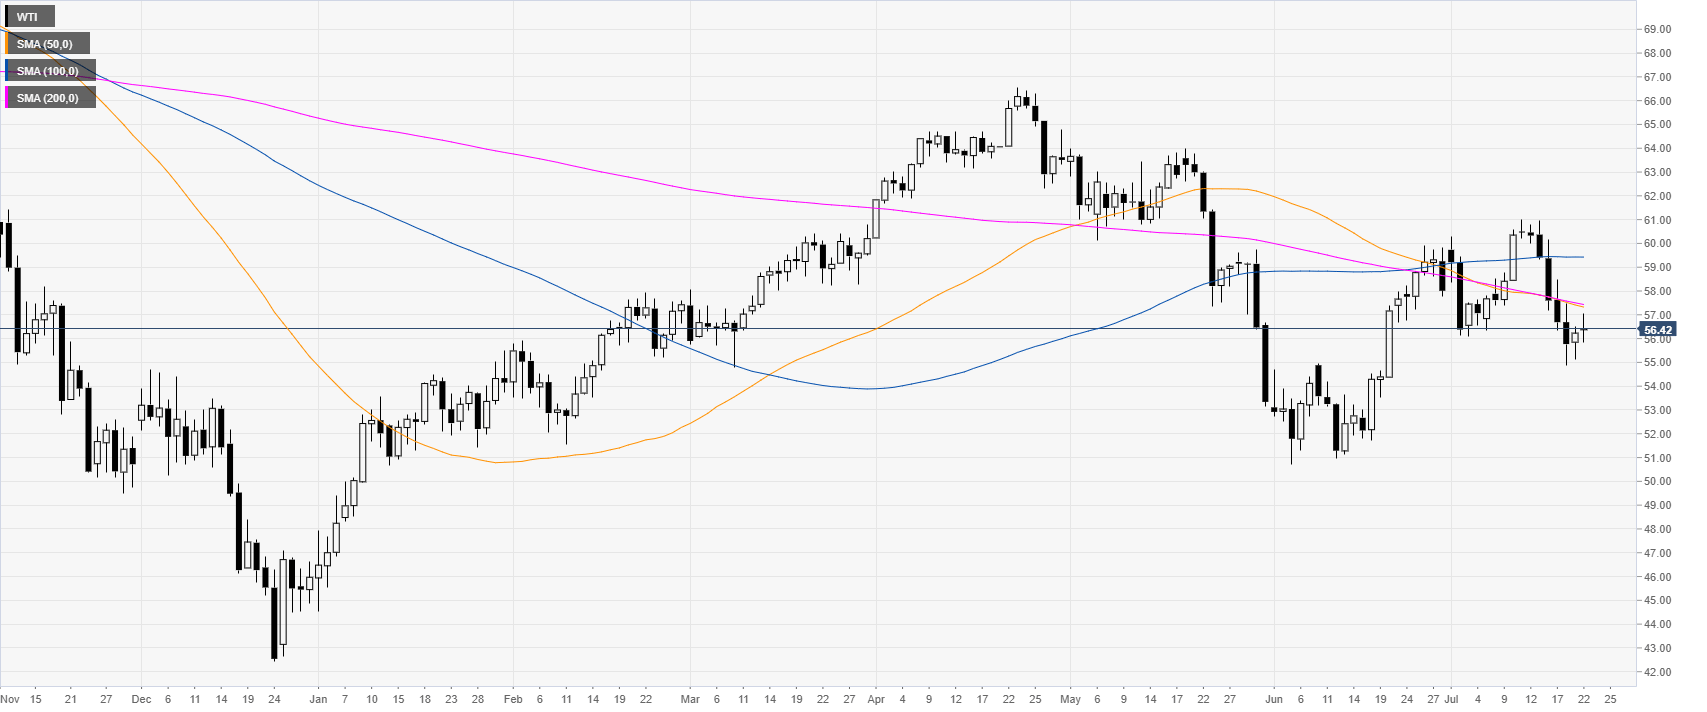
Oil daily chart
WTI (West Texas Intermediate) is consolidating the losses seen last week as it trading below $57.00 a barrel . The market is trading below its main daily simple moving averages (DSMAs).
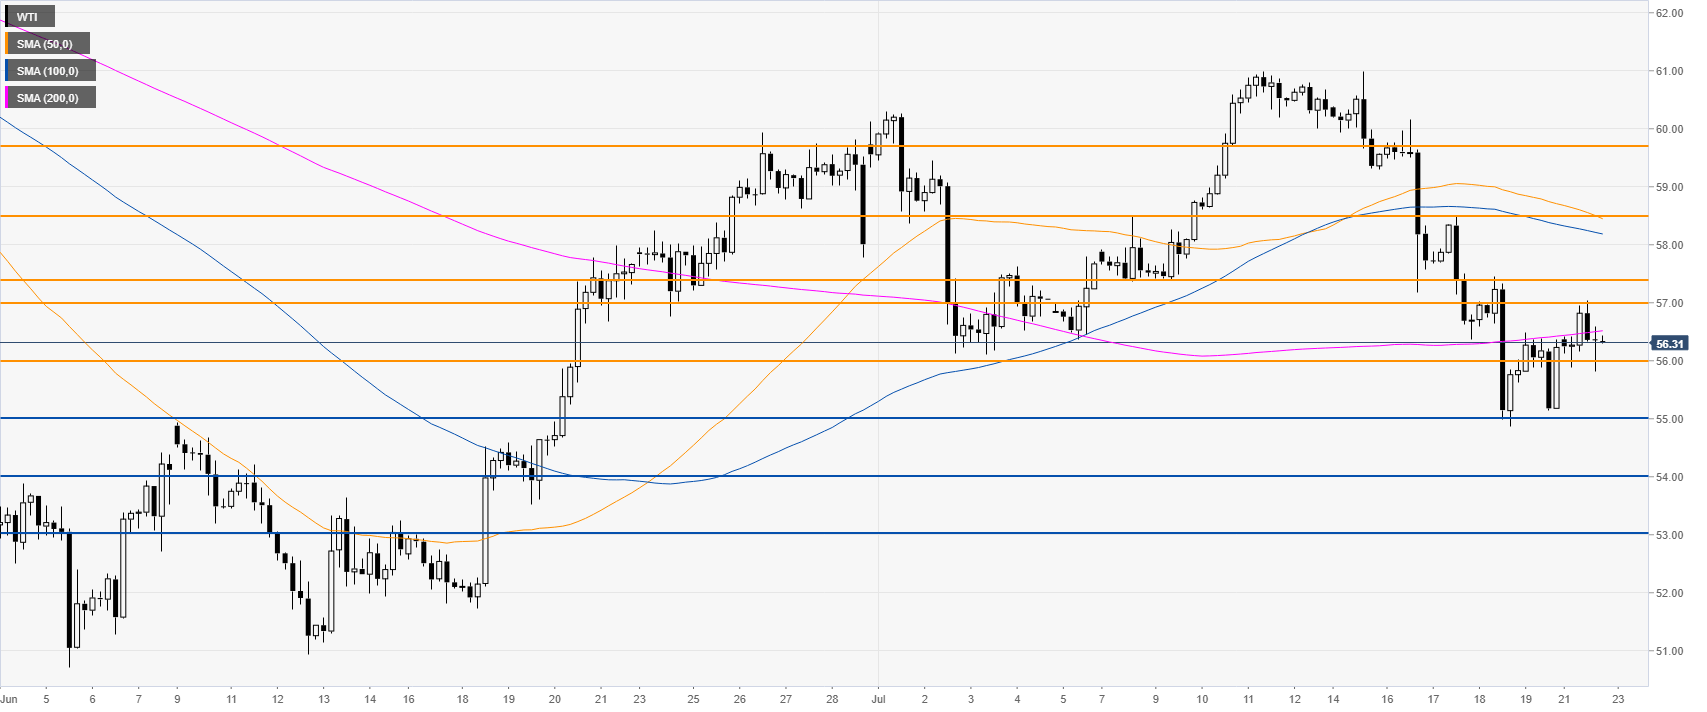
Oil 4-hour chart
The oil market is trading between the 56.00 and 57.00 level while below the 200 SMA, suggesting an overall bearish bias. A break below 56.00 can lead to 55.00 in the medium term.
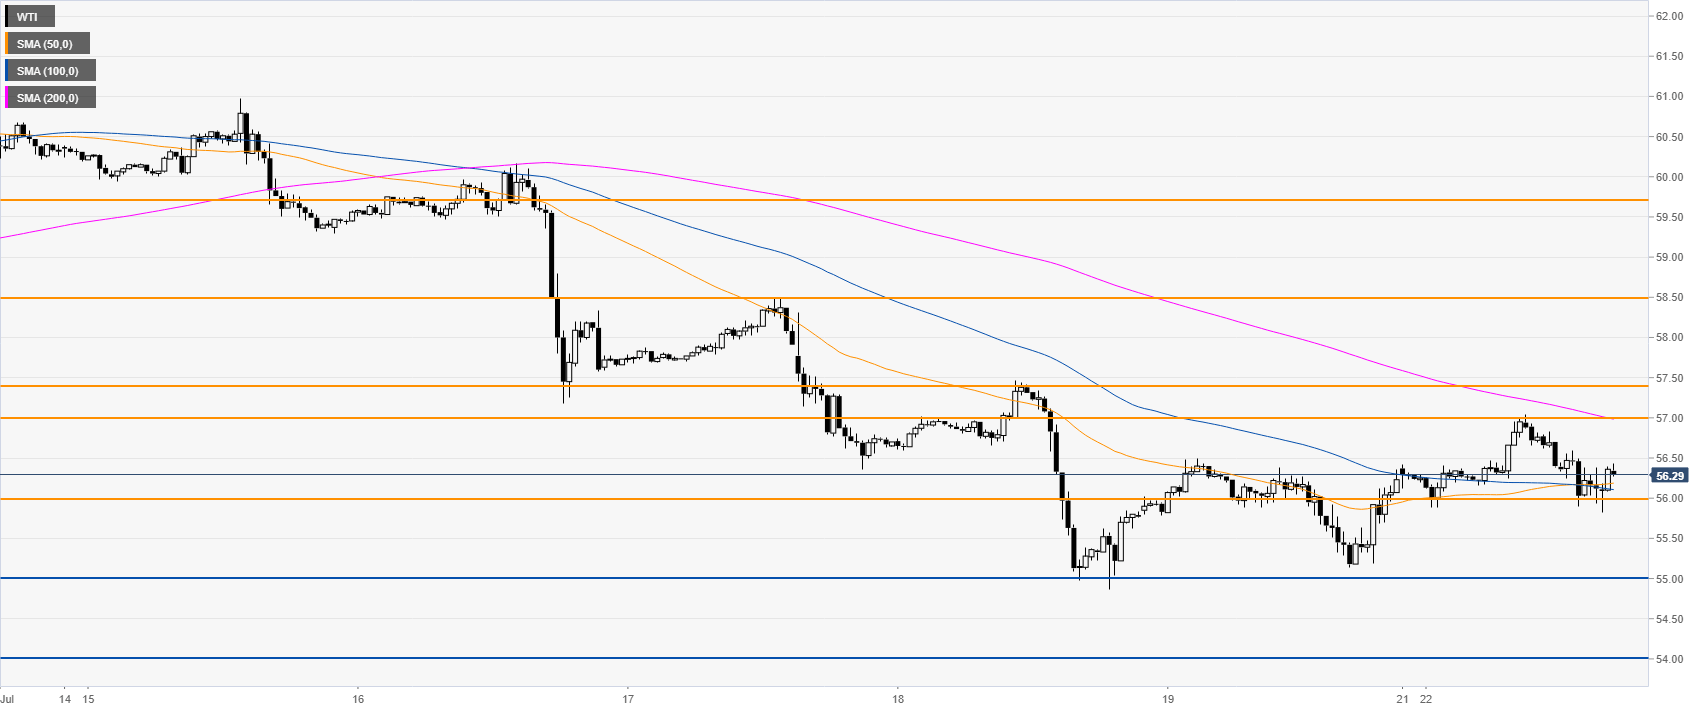
Oil 30-minute chart
Oil is trading below its trading below a descending 200 SMA suggesting bearish pressure in the near term. The market could find immediate resistances at 57.00 and 57.40
Additional key levels