Back


29 Aug 2019
USD/JPY technical analysis: Challenging weekly highs ahead of the Tokyo Consumer Price Index
- USD/JPY is challenging the weekly highs ahead of the release of the Tokyo inflation at 23:30 GMT.
- The levels to beat for bulls are at the 106.77 and 107.07 resistances.
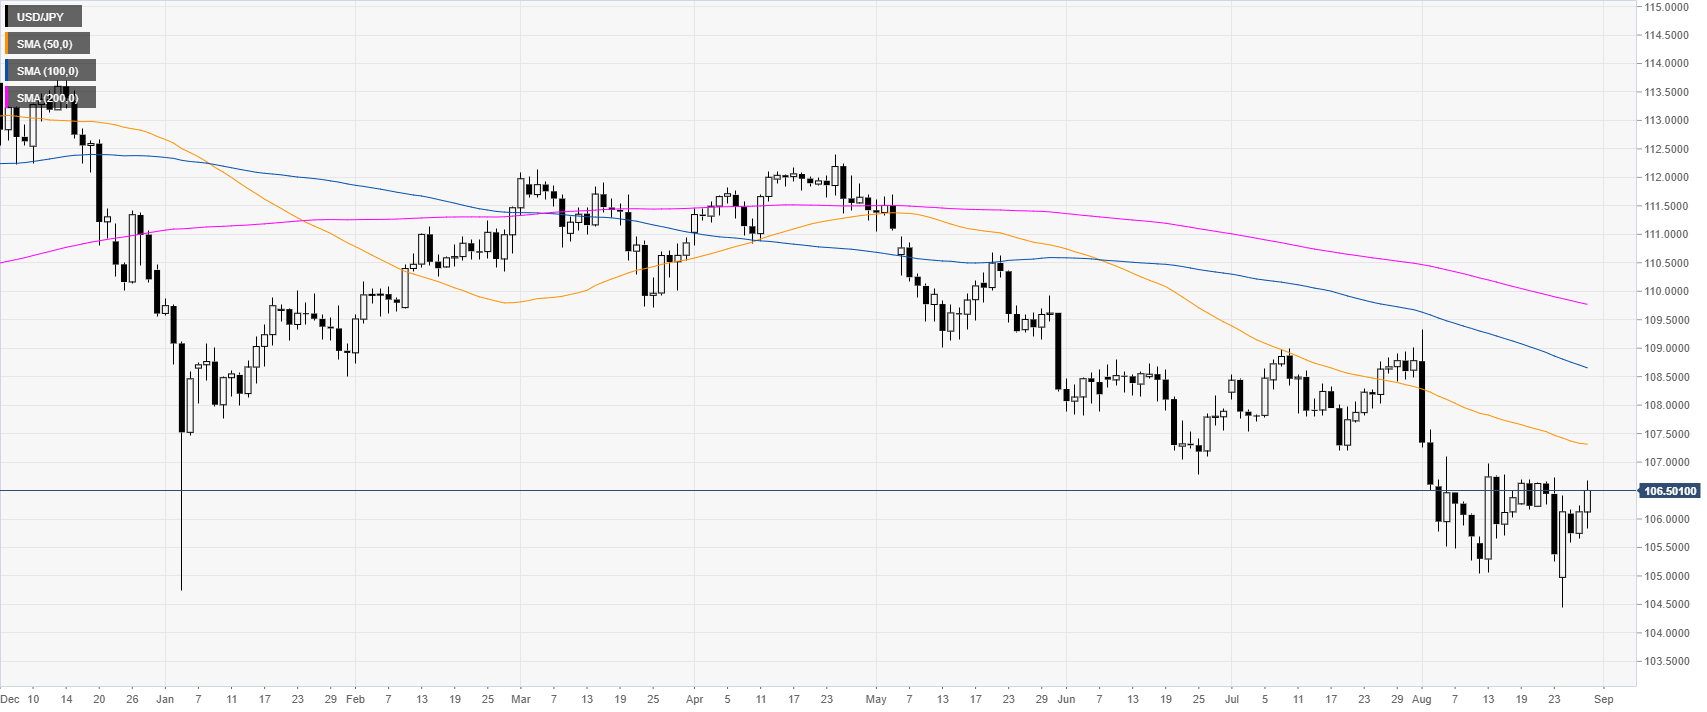
USD/JPY daily chart
USD/JPY is trading in the upper half of its weekly range while trading below its main daily simple moving averages (DSMAs). The market is holding above the 106.00 handle as the bear trend is currently on hold.

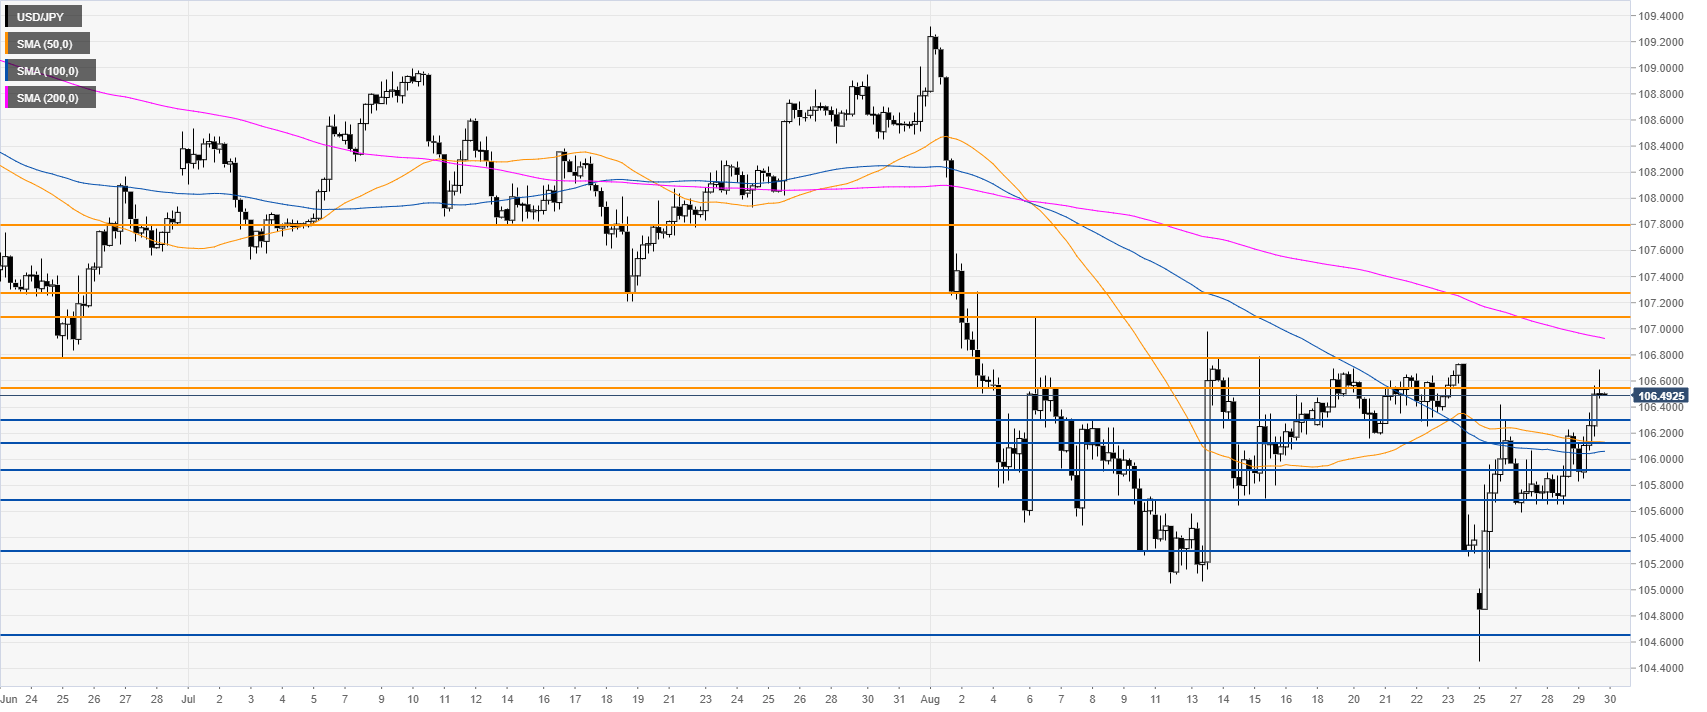
USD/JPY 4-hour chart
USD/JPY is challenging the 106.55 resistance. Bulls would need a daily close above 106.77 resistance to drive the market towards 107.07, 107.22 and 107.77 resistance levels, according to the Technical Confluences Indicator.

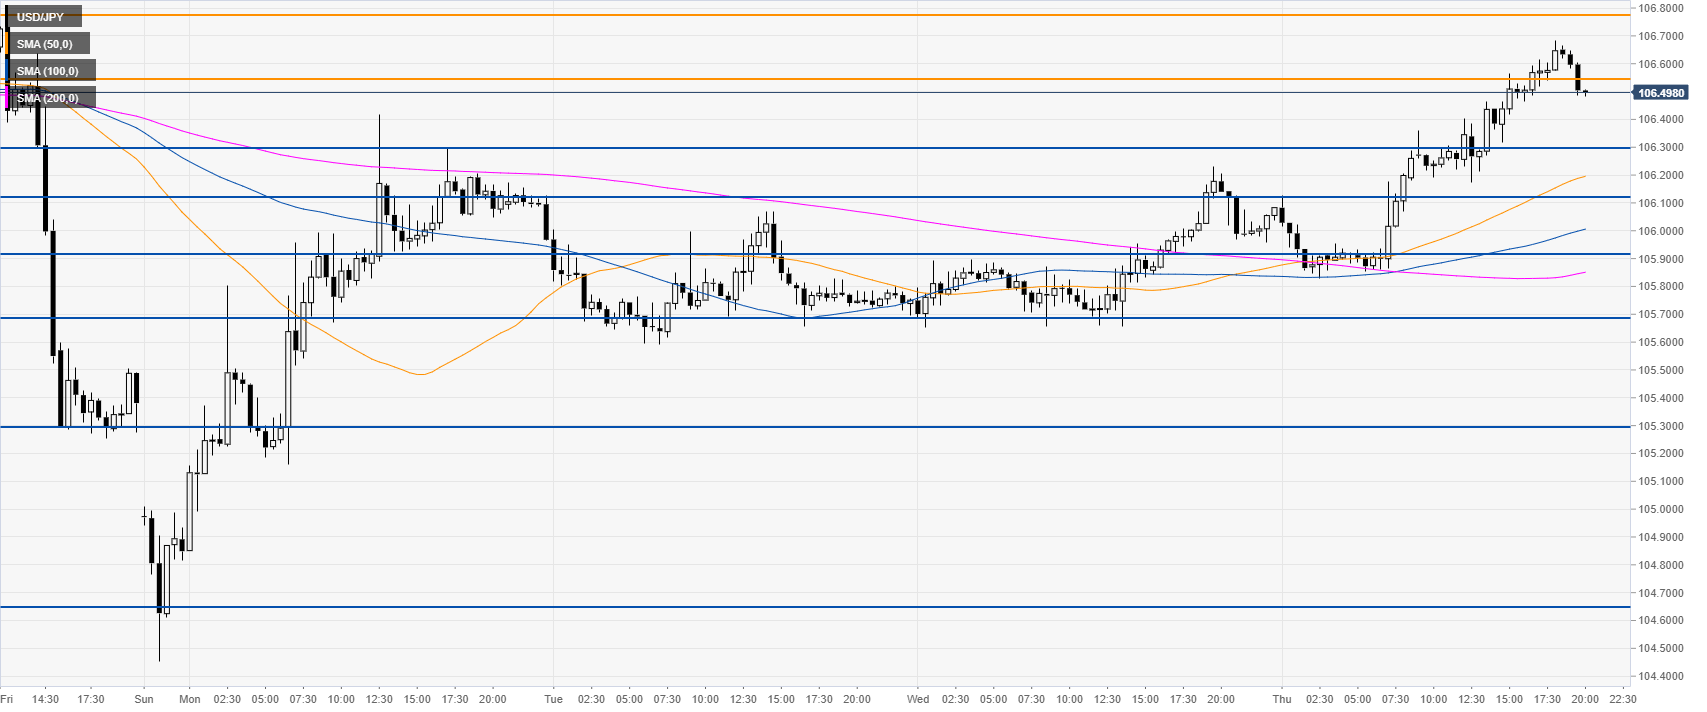
USD/JPY 30-minute chart
Dollar/Yen is trading above its main SMAs, suggesting bullish momentum in the near term. Immediate support is seen at 106.30, 105.12 and 105.90 according to the Technical Confluences Indicator. The Tokyo Consumer Price Index at 23:30 GMT can lead to high volatility in JPY-related pairs.

Additional key levels
