Back
18 Oct 2019
GBP/USD technical analysis: Cable off daily highs trading near 1.2875 level
- The Cable is consolidating the recent gains trading just below the 1.2900 handle.
- The level to beat for bulls is the 1.2900 figure followed by the 1.3000 round number.
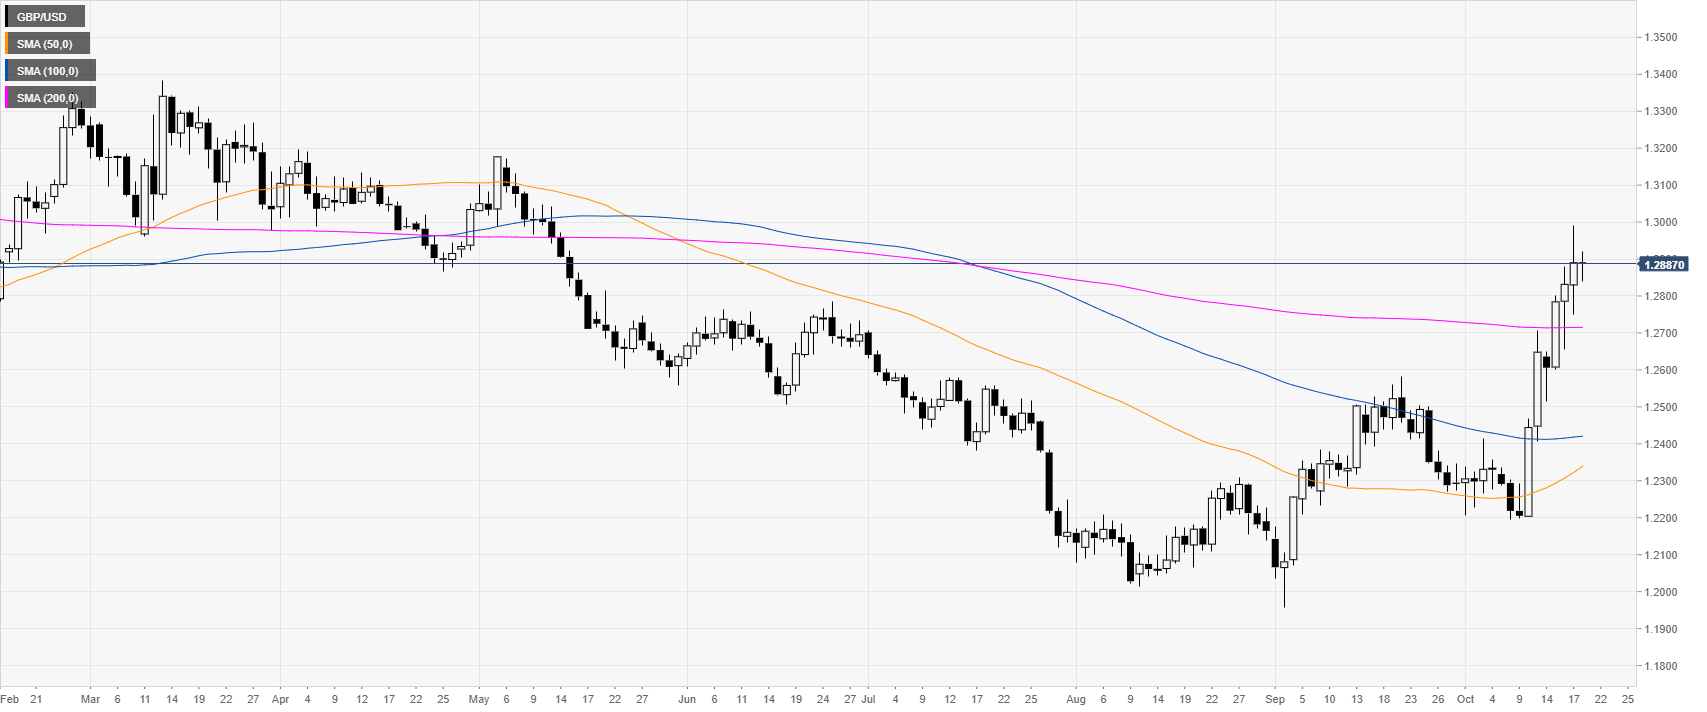
GBP/USD daily chart
The Pound, on the daily time frame, is spiking above its main daily simple moving averages (DSMAs). GBP/USD is trading at levels last seen in mid-May 2019.
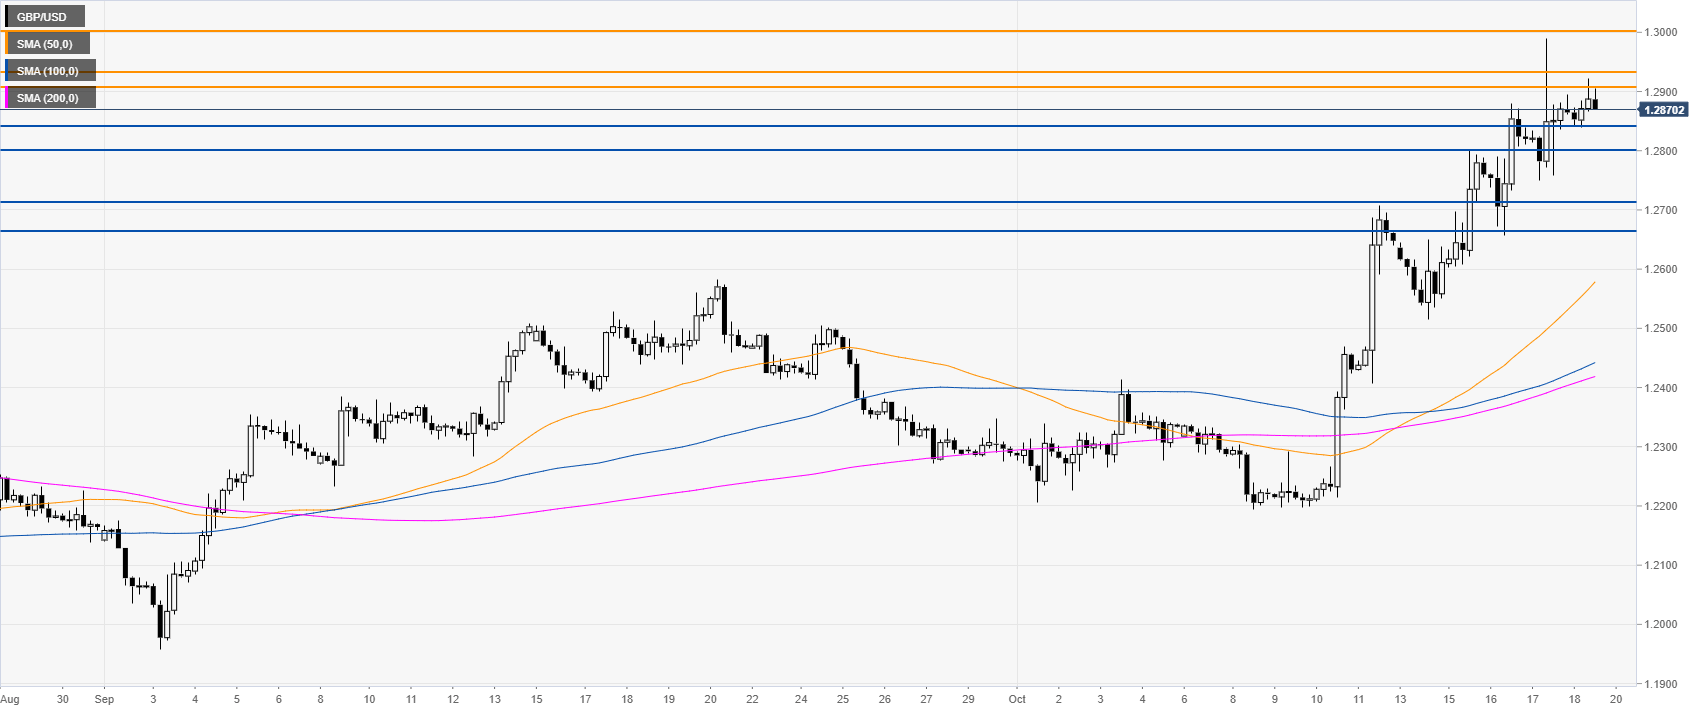
GBP/USD four-hour chart
GBP/USD is currently trading below the 1.2900 level. A break above this level is necessary for a re-test of the 1.3000 handle.
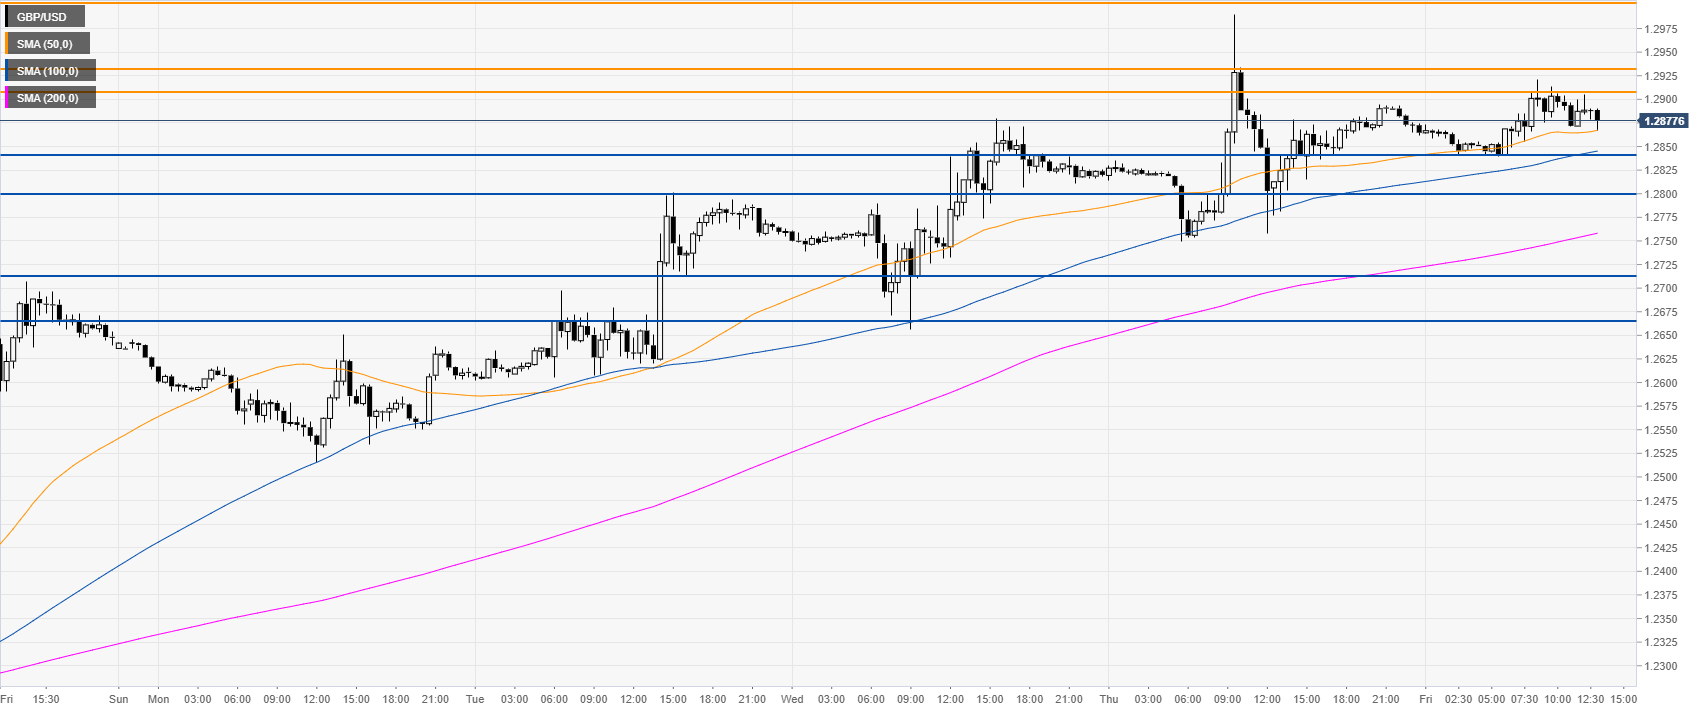
GBP/USD 30-minute chart
GBP/USD is trading above the main SMAs, suggesting bullish momentum in the near term. Support is seen at the 1.2840 and 1.2800 price levels, according to the Technical Confluences Indicator.
Additional key levels