Back
28 Oct 2019
GBP/USD technical analysis: Cable off daily highs, trading sub-1.2900 handle
- GBP/USD bounced from the 1.2815 support level this Monday.
- In the medium term, the level to beat for sellers remains the 1.2815/1.2772 support zone.
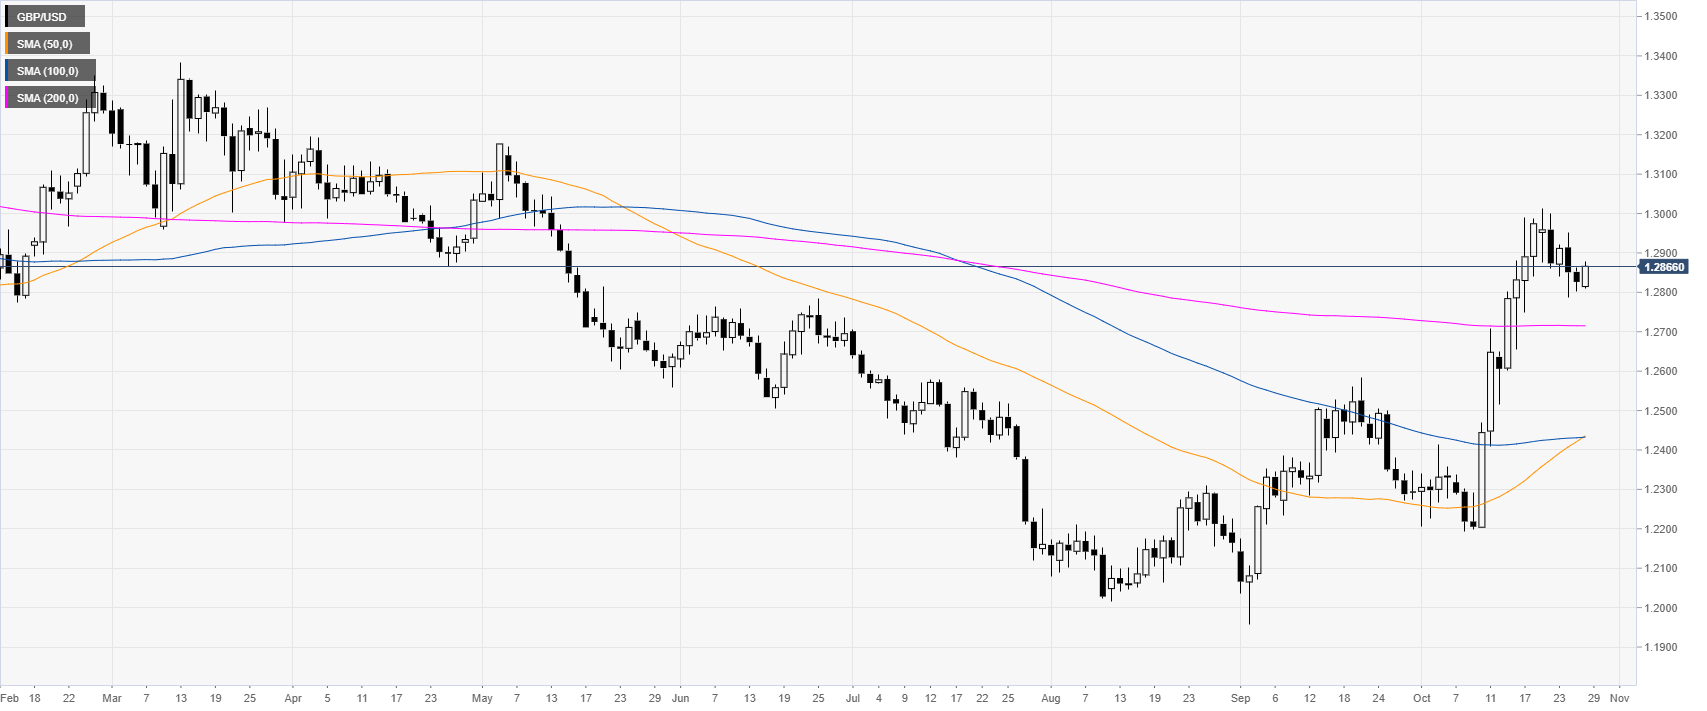
GBP/USD daily chart
In October, the Cable spiked up above its main daily simple moving averages (DMAs) and hit levels not seen since mid-May 2019. The Brexit headlines are behind the main drivers behind the Sterling swings.
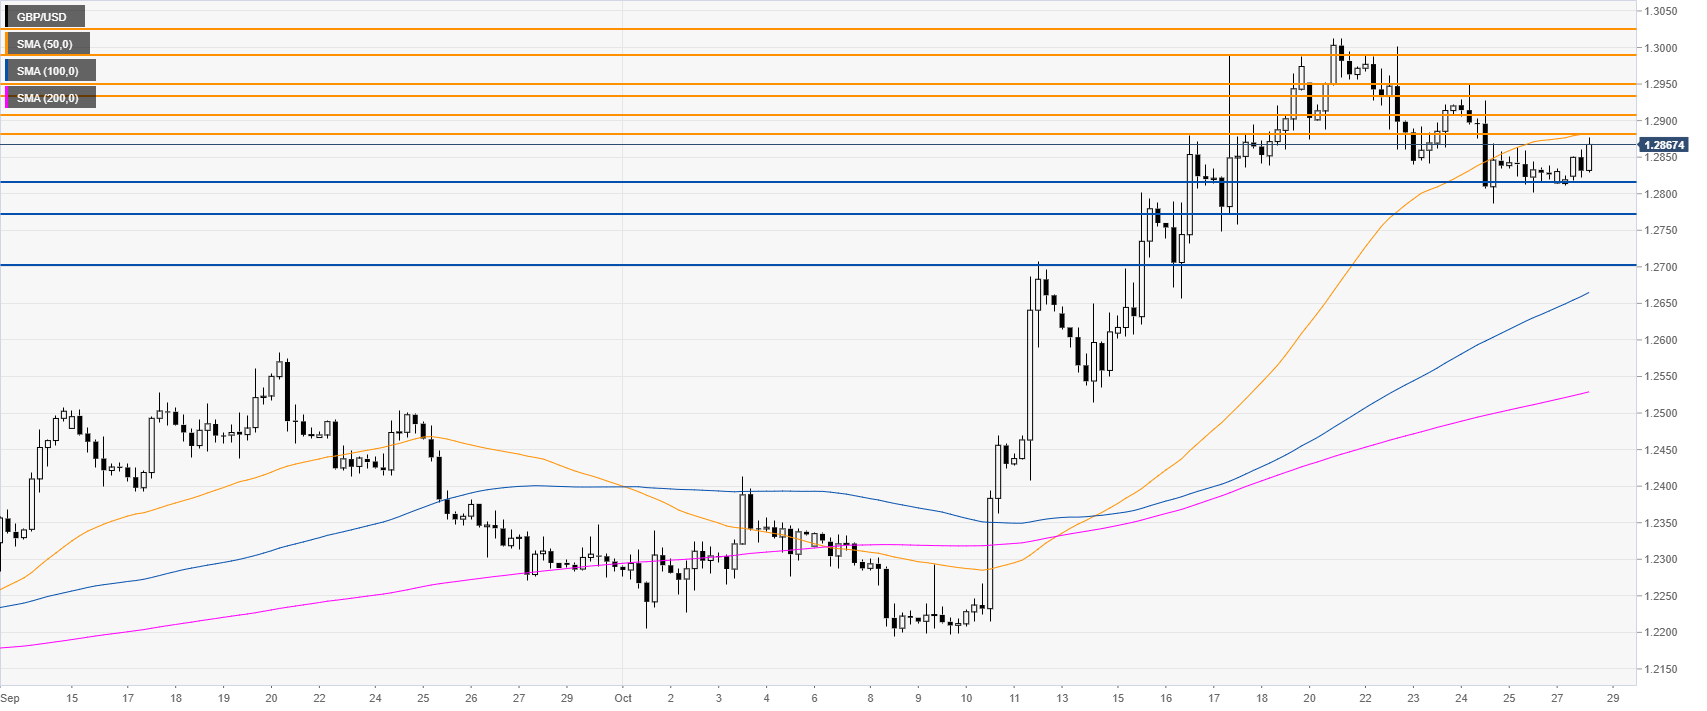
GBP/USD four-hour chart
GBP/USD is retracing down below the 1.2900 handle and the 50 SMA. The spot is challenging the 1.2880 resistance near the 50 SMA. If the market surpasses that level there is room for a retest of the 1.2950/1.3000 zone, according to the Technical Confluences Indicator.
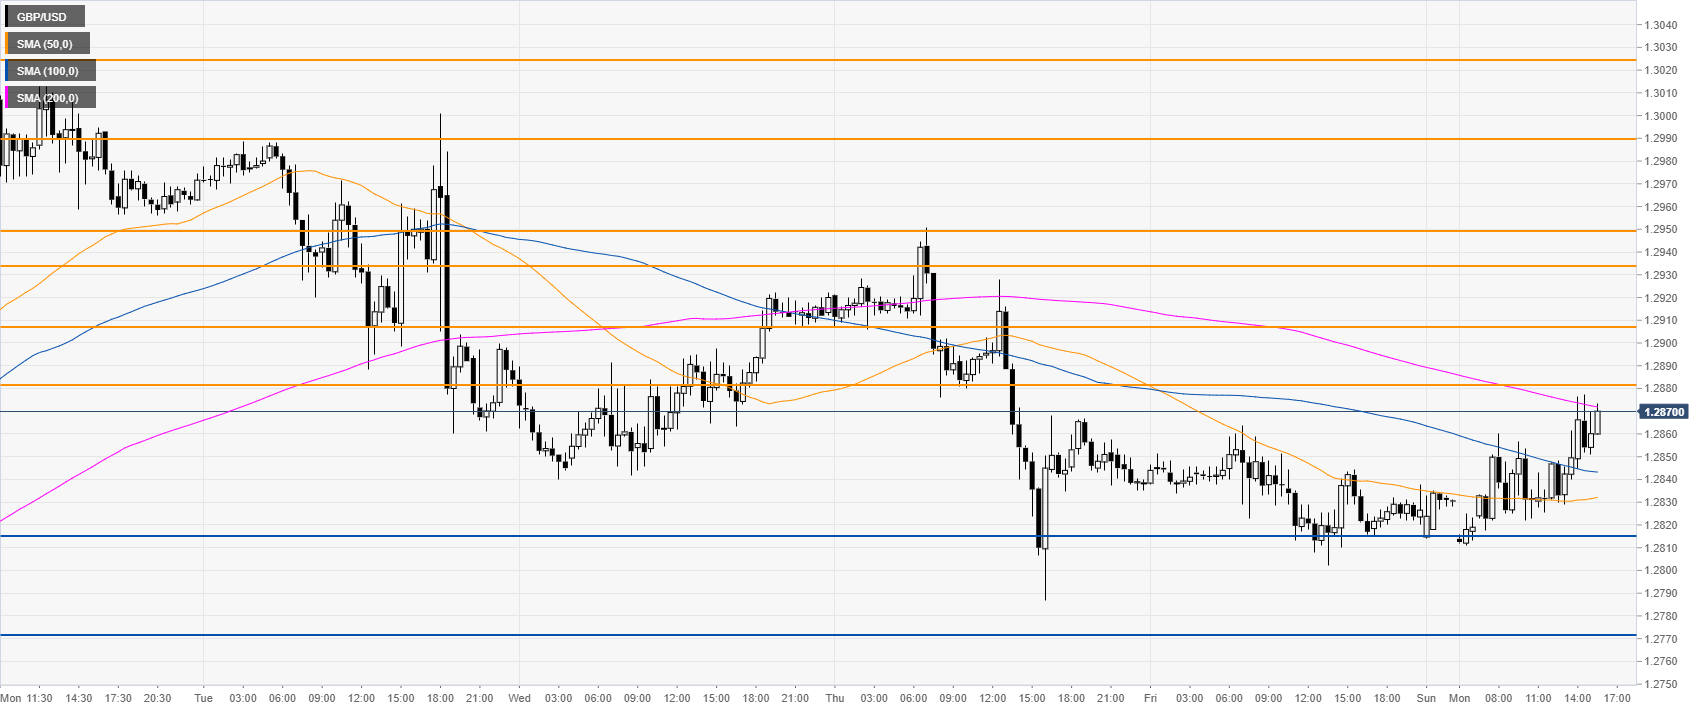
GBP/USD 30-minute chart
GBP/USD is trading below its main SMAs, suggesting a bearish bias in the near term. Sellers need a daily break below the 1.2815/1.2772 support zone to potentially reach the 1.2700 handle, according to the Technical Confluences Indicator.
Additional key levels