Back


30 Oct 2019
US Dollar Index technical analysis: DXY rolling into the Asian session below 97.70 level
- The US Dollar Index (DXY) is ending Tuesday in the red after failing to break above the 97.90 resistance.
- Support is seen at the 97.60 and 97.45 price levels.
- The main macroeconomic event of the week is likely going to be the Fed Interest Rate Decision on Wednesday.
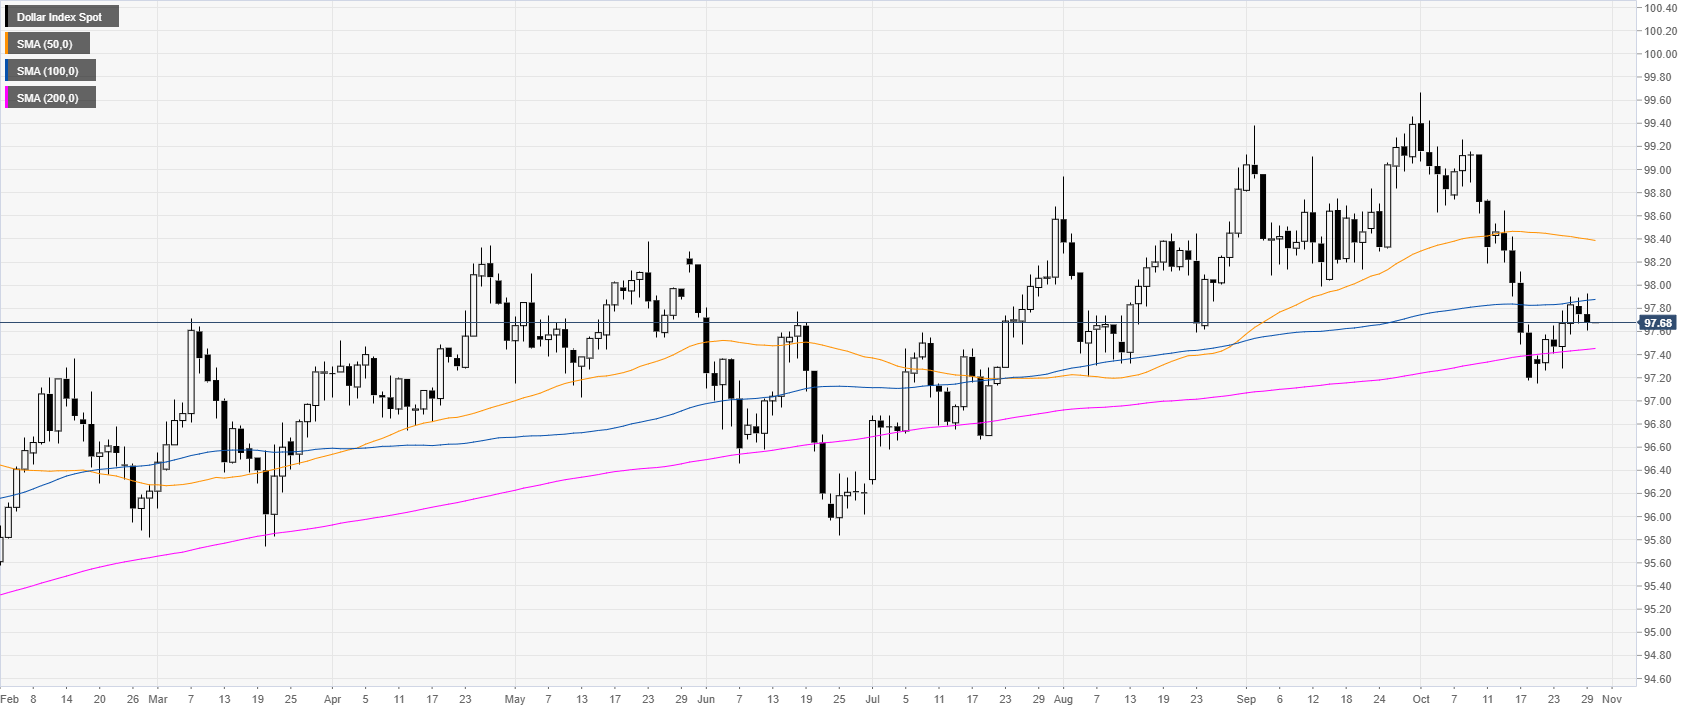
DXY daily chart
The US Dollar Index (DXY) is trading above the 200-day simple moving average (DMA) after a sharp decline in October. This Tuesday, the buck found resistance at the 97.90 resistance and declined for most part of the day. The major macroeconomic event of the week is most likely going to be the Fed Interest Rate Decision on Wednesday.

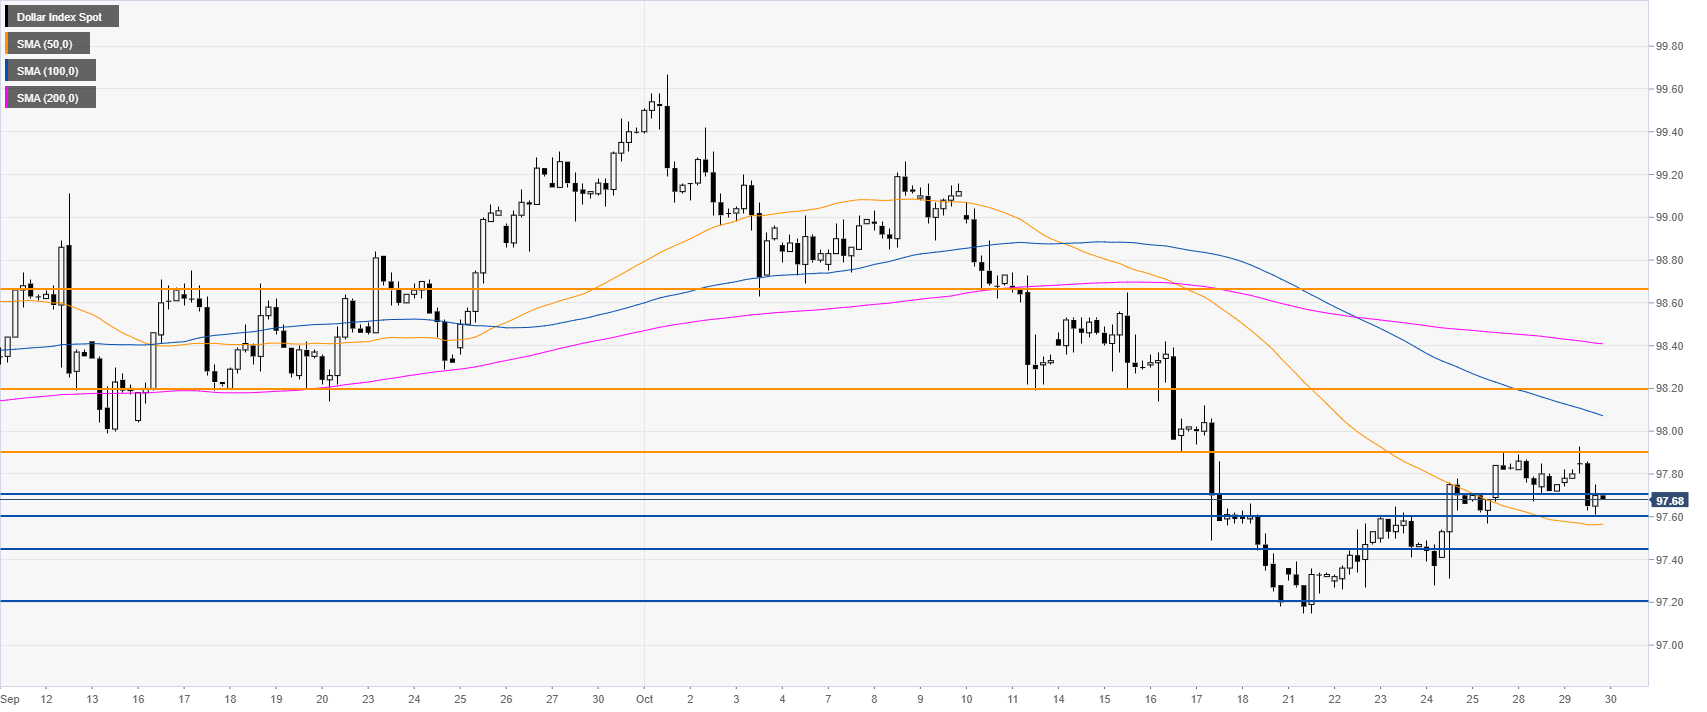
DXY four-hour chart
On the four-hour chart, the Greenback is trading above the 50 SMA but below its 100 and 200 SMAs. In order to confirm the bullish bias, DXY would need to break above the 97.90 resistance on a daily basis. Resistances on the way up can be seen near the 98.20 and 98.66 price levels.

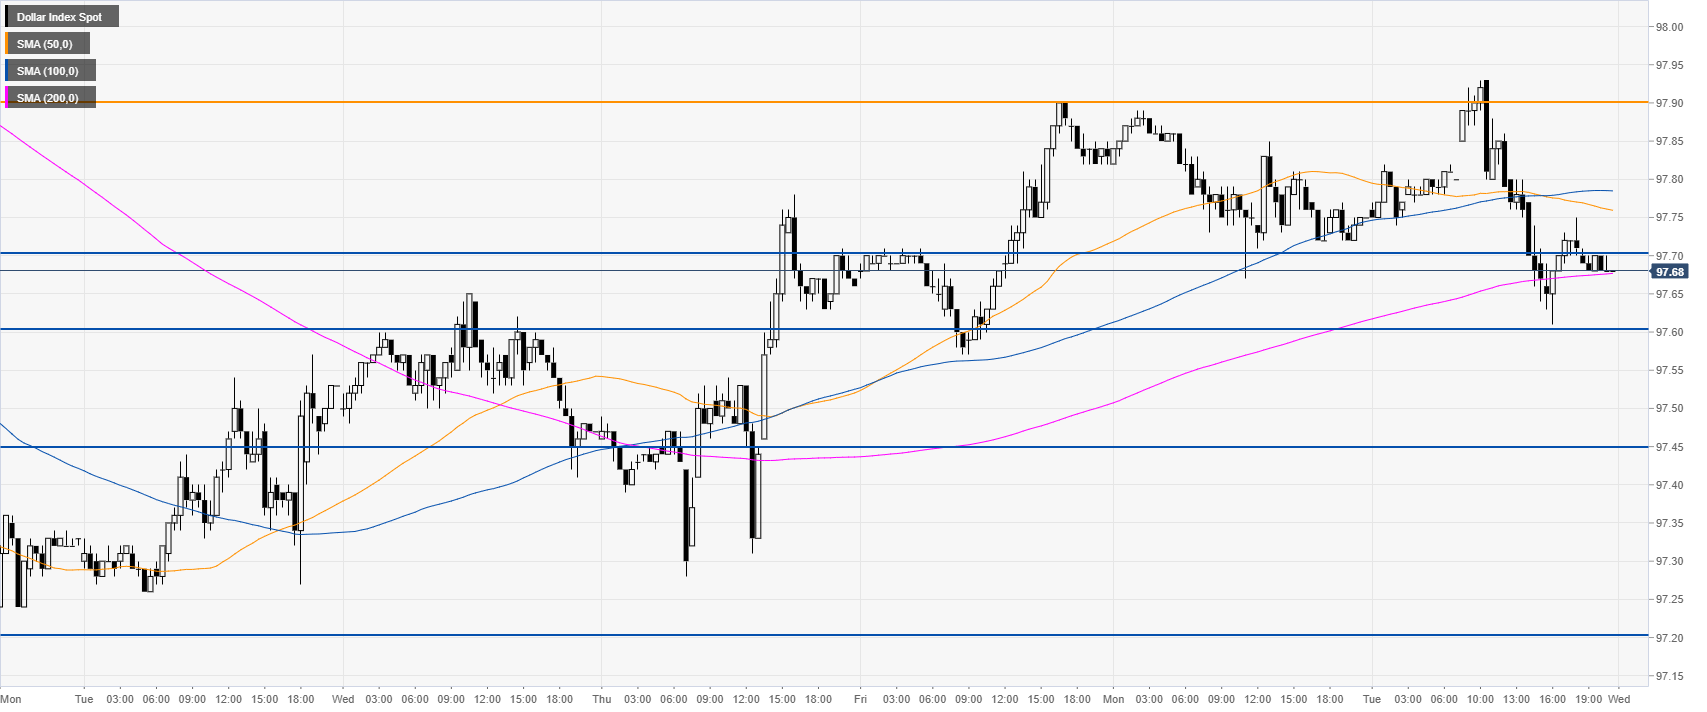
DXY 30-minute chart
DXY is testing the 200 SMA. Bulls will need to defend the 97.60 support if they intend to keep the bullish momentum in the short term intact. Support is seen in the 97.70/60 zone and further down at the 97.45 level.

Additional key levels
