Back
20 Dec 2019
USD/IDR Technical Analysis: 21-day EMA, two-week-old falling trendline limit immediate upside
- USD/IDR pauses the previous two-day downward trajectory.
- 200-day EMA and two-month-old trend line act as the tough nut to crack for buyers.
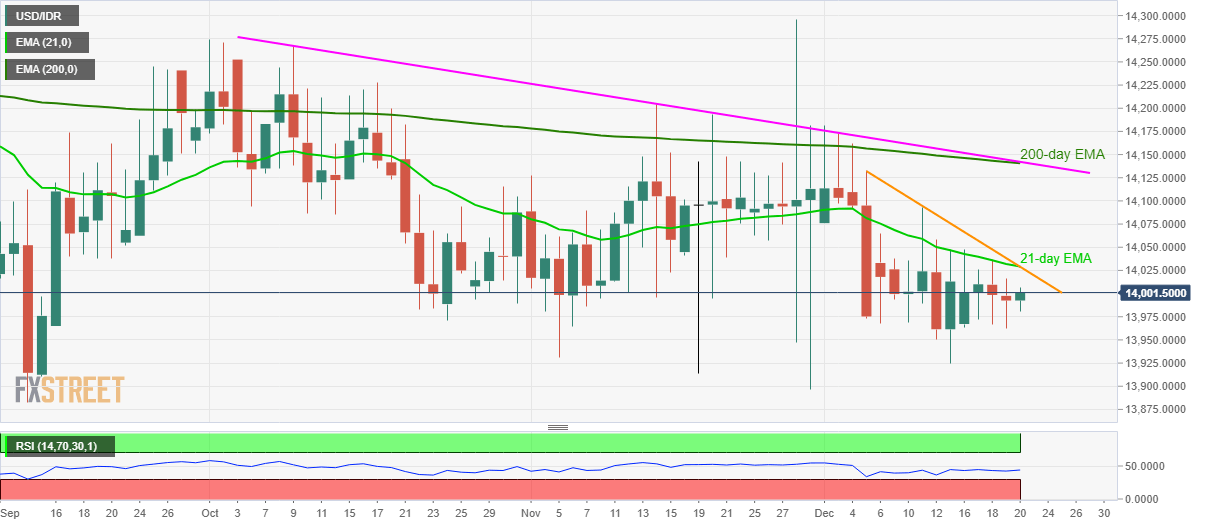
USD/IDR crosses 14,000 by the press time of the pre-European session on Friday. The pair stops the previous declines and rises for the first time in three days.
Even so, 21-day Exponential Moving Average (EMA) and a falling trend line since December 05 will question the buyers around 14,025/30, a break of which will escalate the recovery towards the last week’s top near 14,100.
During the pair’s rise past-14,100, a downward sloping trend line since early October and 200-day EMA level around 14,140 will be the key to watch.
Meanwhile, lows marked in September and July months near 13,880 seem to be the tough support for sellers to watch.
USD/IDR daily chart
Trend: Bearish