USD/JPY Price Analysis: Justifies Monday’s bullish spinning top
- USD/JPY holds onto recovery gains from 21-day SMA.
- A sustained break of monthly high will divert the bulls towards the yearly top.
- 200-day SMA acts as key support.
USD/JPY registers 0.10% gains while rising to 109.85 by the press time of the pre-European session on Tuesday. In doing so, the quote justifies the bullish candlestick formation portrayed the previous day.
As a result, prices are now gearing up to the monthly top surrounding 110.05, a break of which will escalate the latest recovery towards January 17 high near 110.30.
Should the bullish technical indicators, namely RSI and MACD, remain solid beyond 110.30, May 21, 2019 top close to 110.70 and 111.00 round-figure will be the bull’s favorites.
On the flip side, a daily closing below 21-day SMA level of 109.53 will negate the bullish candlestick formation by dragging it to January 28 high of 109.27.
Even so, bears will wait for entry unless the USD/JPY prices drop below the 200-day SMA level of 108.37. Following that, the pair’s declines to the yearly bottom near 107.65 can’t be ruled out.
USD/JPY daily chart
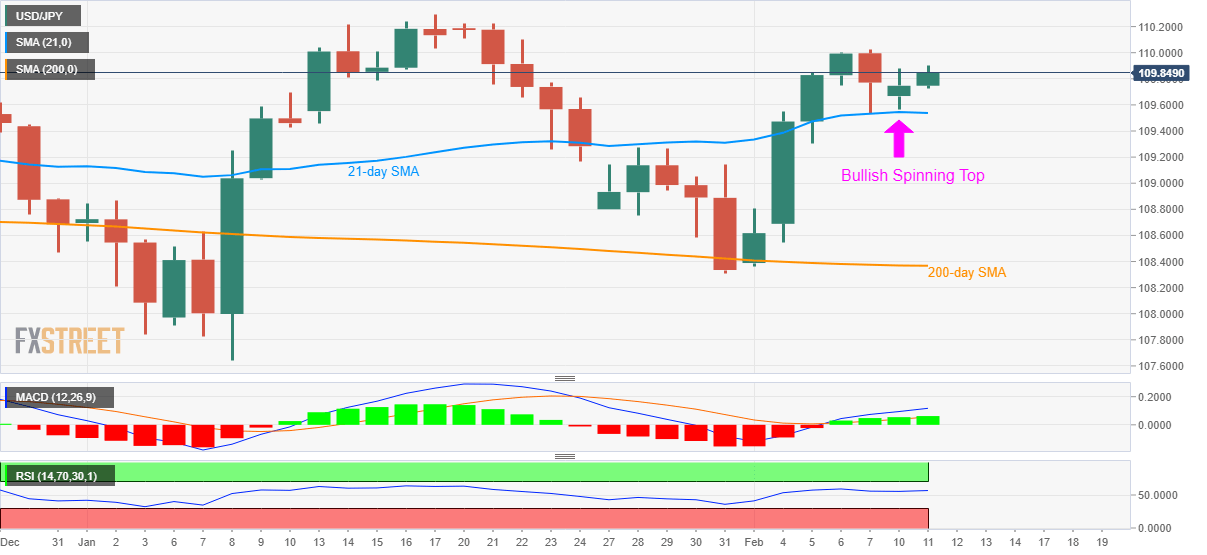
Trend: Bullish
FXStreet Indonesian Site - new domain!
Access it at www.fxstreet-id.com