Back
14 Feb 2020
NZD/USD Price Analysis: Kiwi is bouncing from 2020 lows, trades above 0.6400 figure
- NZD/USD is easing down after bouncing from 2020 lows.
- Resistance is seen near the 0.6443 level.
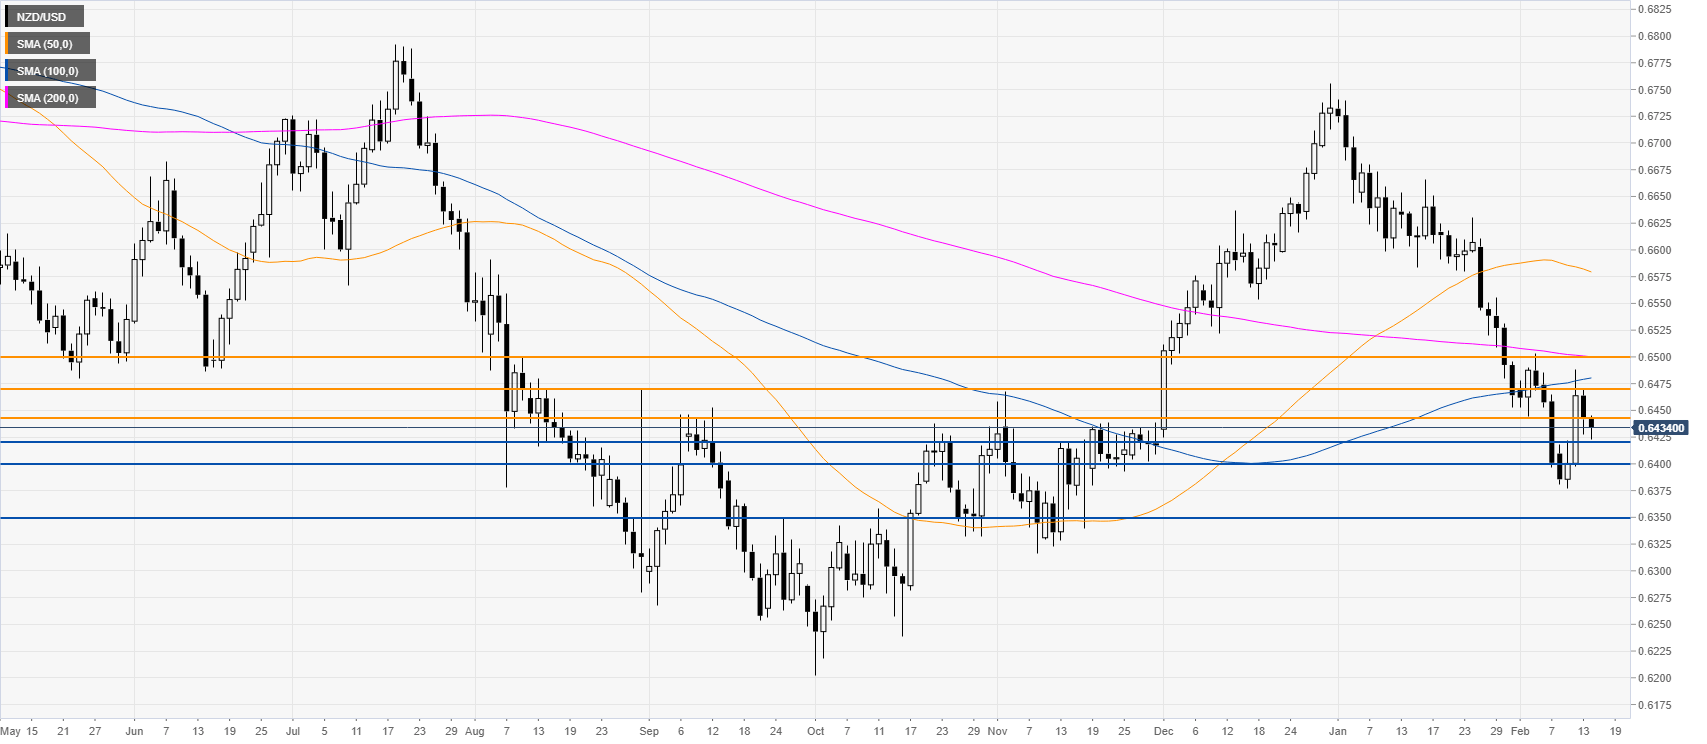
NZD/USD daily chart
After bouncing from fresh 2020 lows, NZD/USD is easing below the 100 SMA. Bears want to extend losses below the 0.6423 level and route toward 0.6400 and 0.6370, according to the Technical Confluences Indicator. However, bulls will try to generate a reversal up breaking above the 0.6443 0.6470 and the 0.6500 figure.
Resistance: 0.6443, 0.6470, 0.6500
Support: 0.6423, 0.6400, 0.6370
Additional key levels