Gold Price Analysis: Depressed below $1,700
- Gold prices fail to extend the late-Friday recoveries.
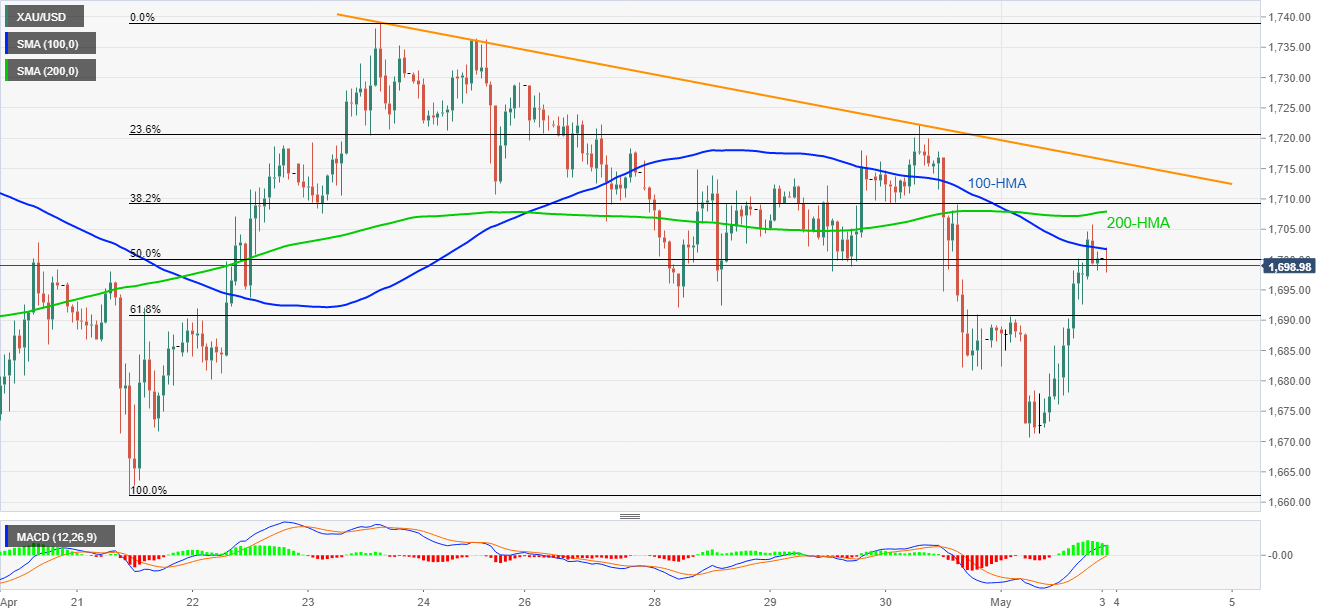
- 100/200-HMAs, short-term falling trend line restrict immediate upside.
- 61.8% of Fibonacci retracement acts as nearby support.
Gold prices drop to $1,698.40, intraday low of $1,697.80, amid the early Asian morning on Monday. In doing so, the yellow metal not only fails to cross 100-HMA and 200-HMA but also stays below a seven-day-old falling trend line.
As a result, sellers might be looking for 61.8% Fibonacci retracement of April 21-23 upside, near $1,691, as immediate support during the further downside.
Even if the MACD fails to remain strong below $1,691, $1,680 and Friday’s low near $1,670 could lure the bears.
Meanwhile, an upside clearance of 100 and 200-HMAs, respectively near $1,702 and $1,708, could escalate the recovery moves towards short-term resistance line, at $1,717 now.
In a case where the buyers manage to cross $1,717, $1,722 and $1,736 can offer intermediate halts during the bullion’s rise towards $1,739 and the previous month high near $1,748.
Gold hourly chart
Trend: Further weakness expected