Back
2 Jun 2020
WTI Price Analysis: Bulls look for entry beyond 50% Fibonacci retracement
- WTI prints mild gains below the intraday high of $35.98.
- Sustained trading beyond 100-day EMA keeps the buyers hopeful.
- The March 11 top acts as immediate resistance before the key Fibonacci retracement level.
Despite stepping back from the intraday high to $35.78, WTI stays 0.15% positive on a day while heading into the European session on Tuesday.
The black gold stays near the 12-week top while also portraying the strength in the upside momentum by trading beyond 100-day EMA.
Though, March 11 top of $36.64 and 50% Fibonacci retracement of January-April downside, around $36.96, seems to question the further upside amid overbought RSI conditions.
Should the quote slips below a 100-day EMA level of $35.35, it can quickly visit April month top near $32.20.
However, an upside clearance above $36.96, also crossing $37.00 round-figures, could push the buyers to fill the early-March month gap below $41.22.
WTI daily chart
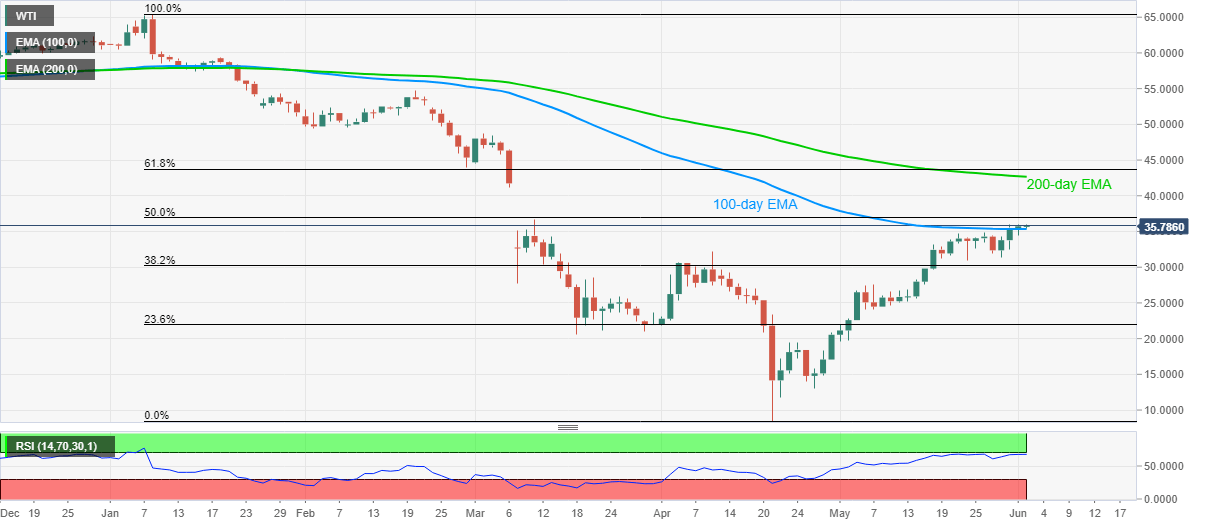
Trend: Pullback expected