Back
22 Jun 2020
Gold Price Forecast: XAU/USD jumps to one-month high
- Gold hits a one-month high of $1,753 on Monday.
- Technical indicators call a re-test of 2020 highs.
Gold is better bid at press time with technical charts reporting bullish patterns.
The yellow metal is currently changing hands at $1,753 per ounce, the highest level since May 20.
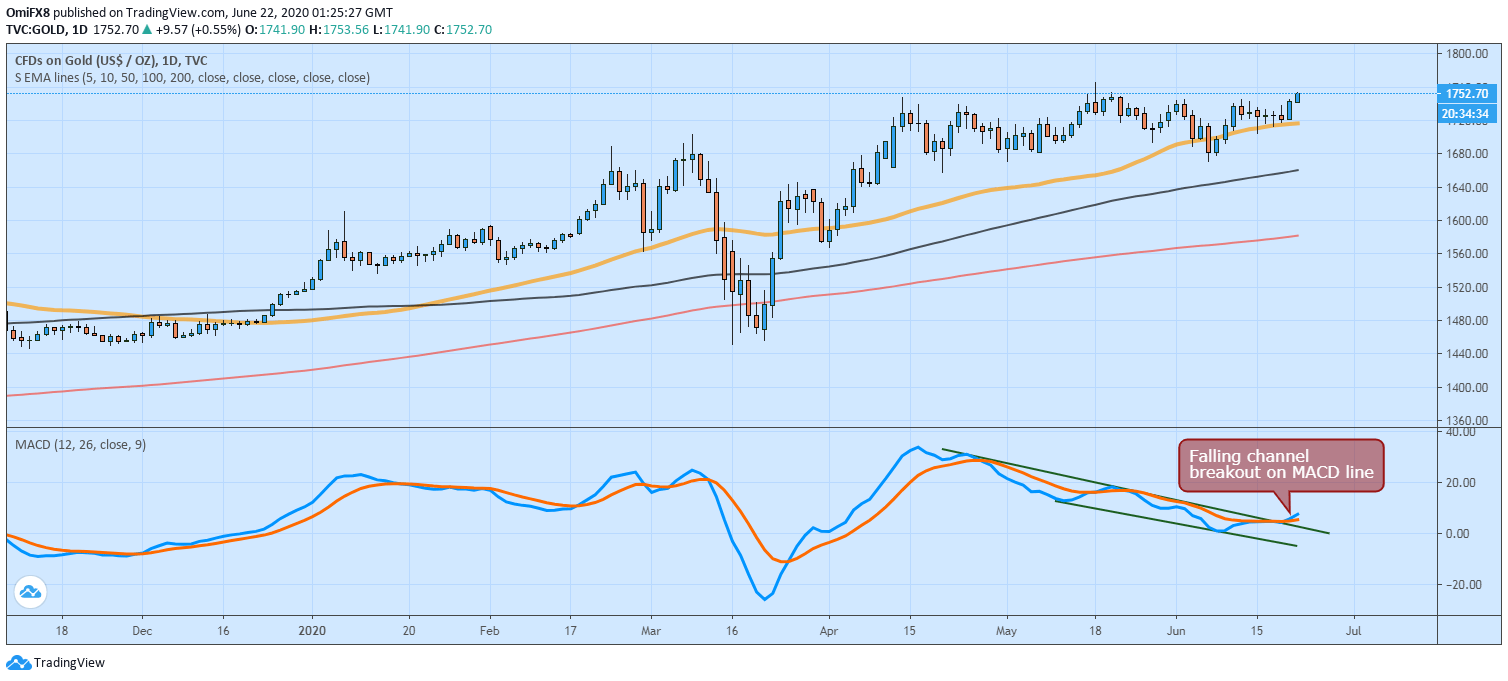
The daily chart MACD and the signal line are reporting a falling channel breakout and the hourly price chart is showing a symmetrical triangle breakout. These patterns indicate that the recovery rally from the June 5 low of $1,670 has resumed and prices could rise to the 2020 high of $1,765 reached on May 18.
Acceptance above that level would expose the psychological hurdle of $1,800. On the downside, a close below $1,704 (June 15 high) is needed to invalidate the bullish setup.
Daily chart
Trend: Bullish
Technical levels