SP 500 Price Analysis: Approaching key support around 3,000 – Confluence Detector
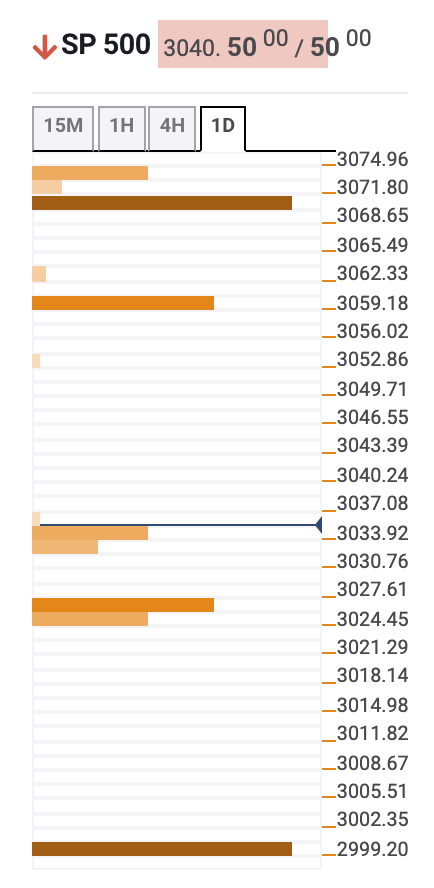
The S&P 500 Index is dropping more than 2% on Wednesday to hit one-week lows at 3.039. Market concerns of a second COVID-19 wave and US President Trump’s threat to impose tariffs on European imports have crushed hopes of a quick post-coronavirus recovery.
The index has broken below the bottom of the last six days’ trading range, at 3,065/70 to test support at the 200-SMA in the 4-hour chart near 3,030. Below here, the Technical Confluence Indicator shows 61.8% Fibonacci one-week support at 3,025 and a 23,8 Fibonacci one-week support level at 2,999.
On the upside, a potential bullish reaction might find resistance at 3,060 (Bollinger band 4-hour lower) and above here, at 3,070 area, the confluence of Bollinger band one-hour lower and previous month-high before 3,080, the confluence of the Fibonacci 38,2% one-week and the pivot point one-day S1.
Here is how it looks on the tool