Back
14 Jul 2020
S&P 500 index Price Analysis: Bulls in charge until a break below support structure
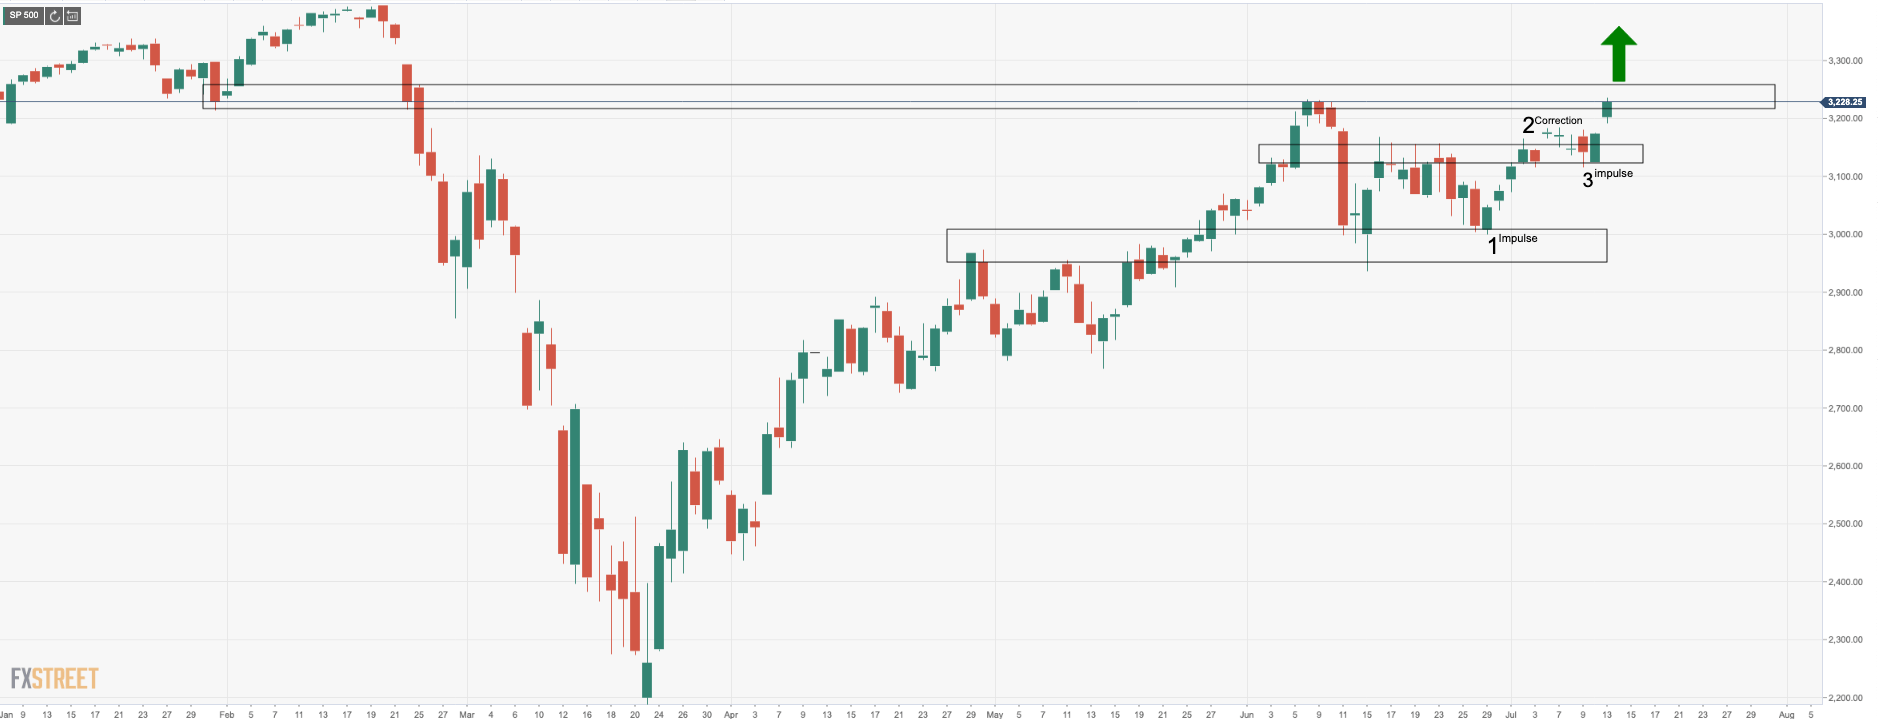
- The S&P 500 is showing no signs of entry at this juncture until it either breaks upside structure, weekly resistance, or fails and break structure to the downside.
- Prudent tradesr will want to see confirmation one way or the other.
- The following is a top-down analysis of the structure of the market.
For a full run down on what to expect from this market for this week, see here: S&P 500 Index Forecast: Bank's earnings in focus, COVID-19 induced insolvency fears simmer away
Daily chart
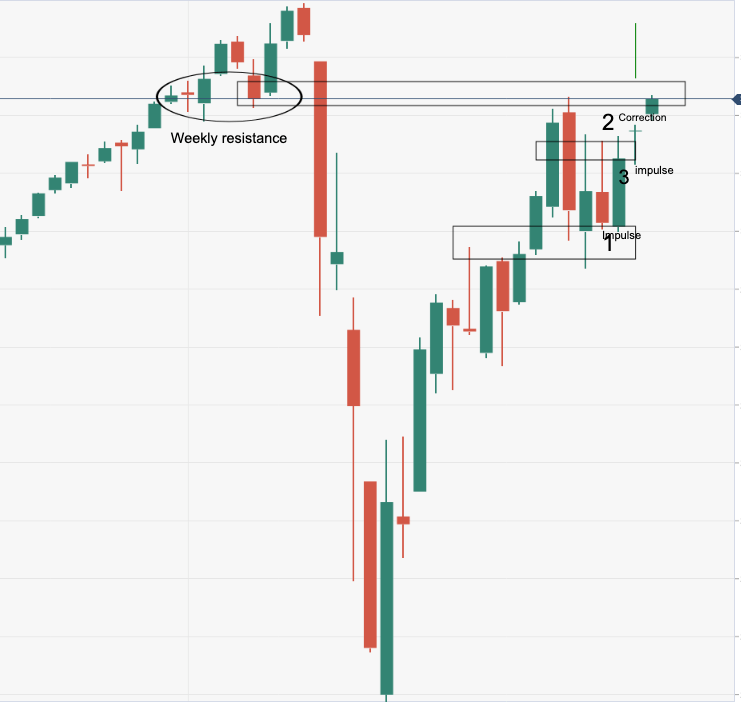
As we can see, in the following chart, the market is at weekly resistance.

The weekly resistance is easily seen here:

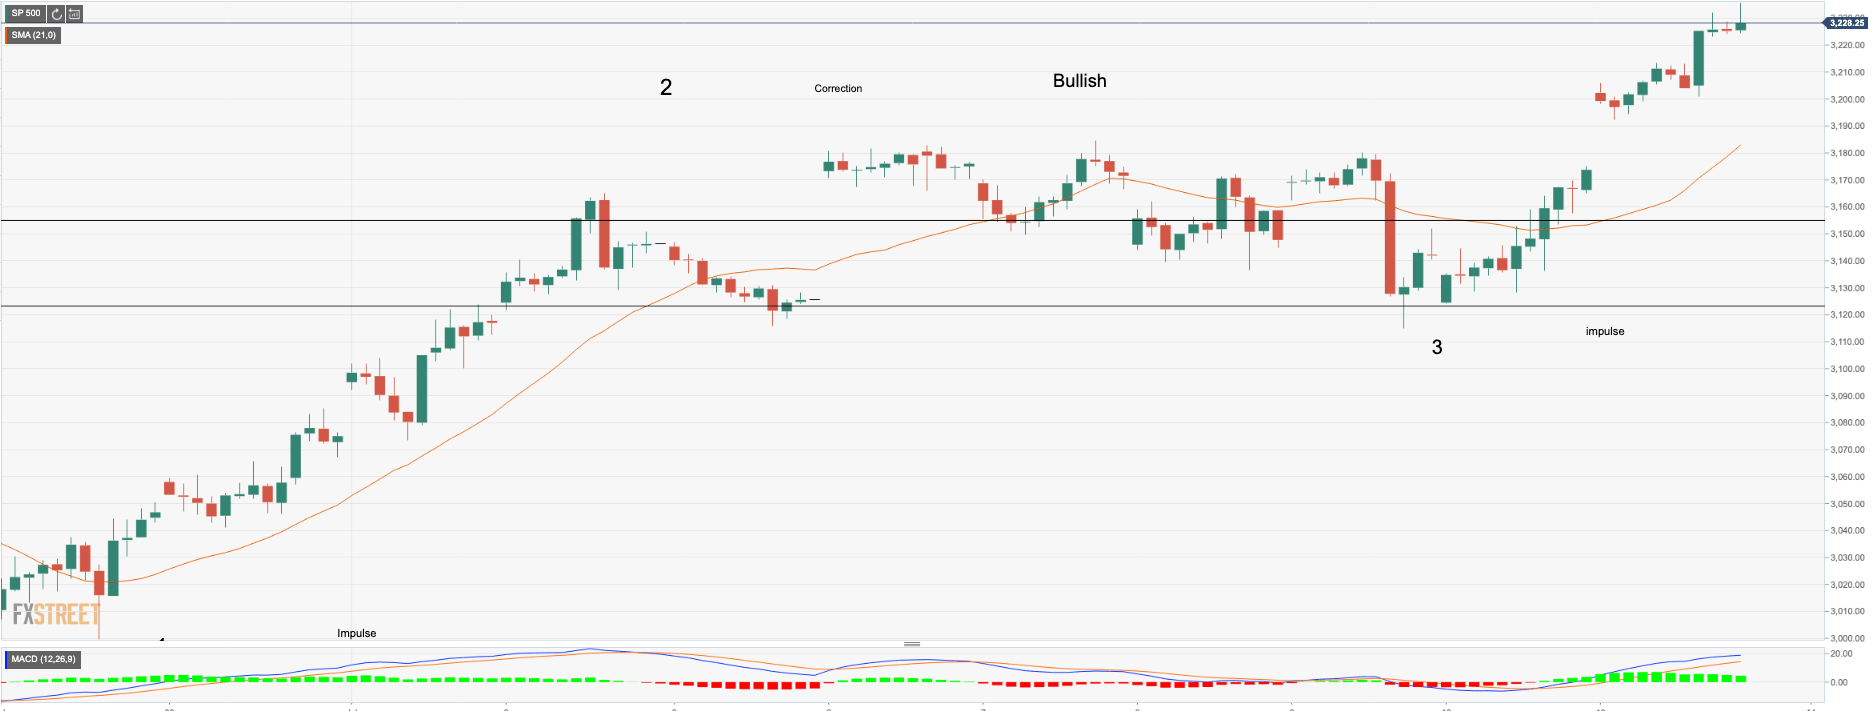
Fron a nearer-term outlook, there is nothing here for the bears and bulls remaining charge with price above the 21-hour moving average and bullish MACD.

