USD/TRY Price Analysis: Choppy between 50 and 100-day EMA
- USD/TRY wavers around 7.7030 after stepping back from 7.7983 the previous day.
- Bears MACD, failures to keep the recoveries favor sellers.
- Levels marked during September offer an additional filter to the downside.
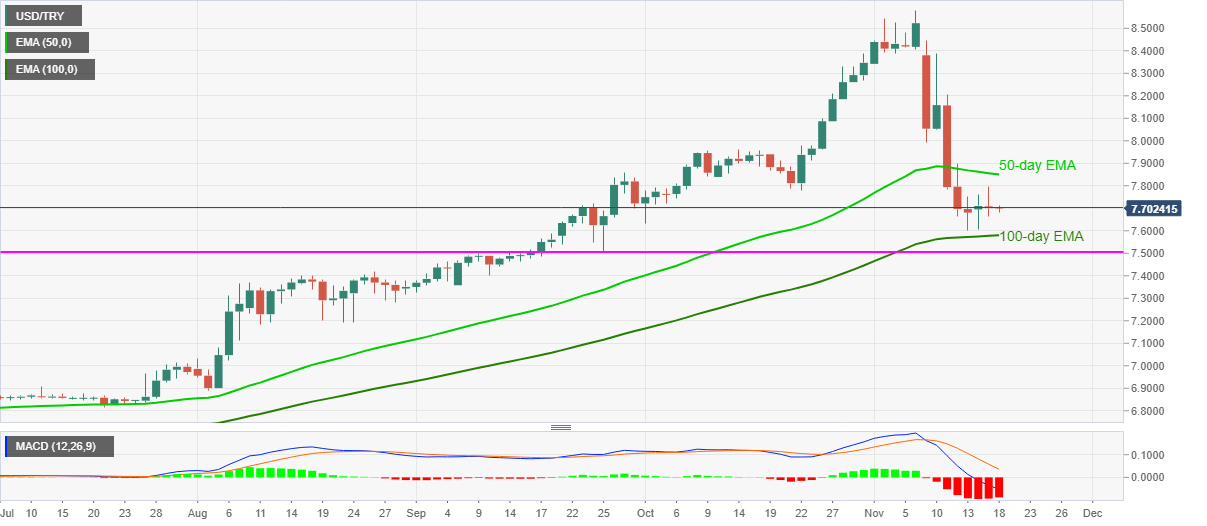
USD/TRY keeps the range between 7.6922 and 7.7133 while taking rounds to 7.7030, up 0.08% intraday during early Wednesday. The pair’s recent recovery moves from 7.6625 may find it difficult to prevail amid bearish MACD. That said, 50-day and 100-day EMAs will also add barriers to the quote’s short-term moves.
However, the previous day’s pullback from 7.7983 has a larger back-up and can again challenge the latest low near 7.6920.
It should be noted that USD/TRY weakness below 7.6920 will be challenged by a 100-day EMA level of 7.5800 as well as multiple levels marked during September around 7.5055.
Alternatively, an upside clearance of the immediate range resistance, namely 7.7133, will escalate the corrective pullback towards the 50-day EMA level of 7.8500.
In a case where the USD/TRY bulls dominate past-7.8500, the mid-October highs near 7.9590 and November 09 low of 7.9940 become the key.
USD/TRY daily chart
Trend: Sideways