GBP/USD Price Analysis: 100-day EMA defends bulls around 1.3900
- GBP/USD sellers take a breather after two-day downtrend.
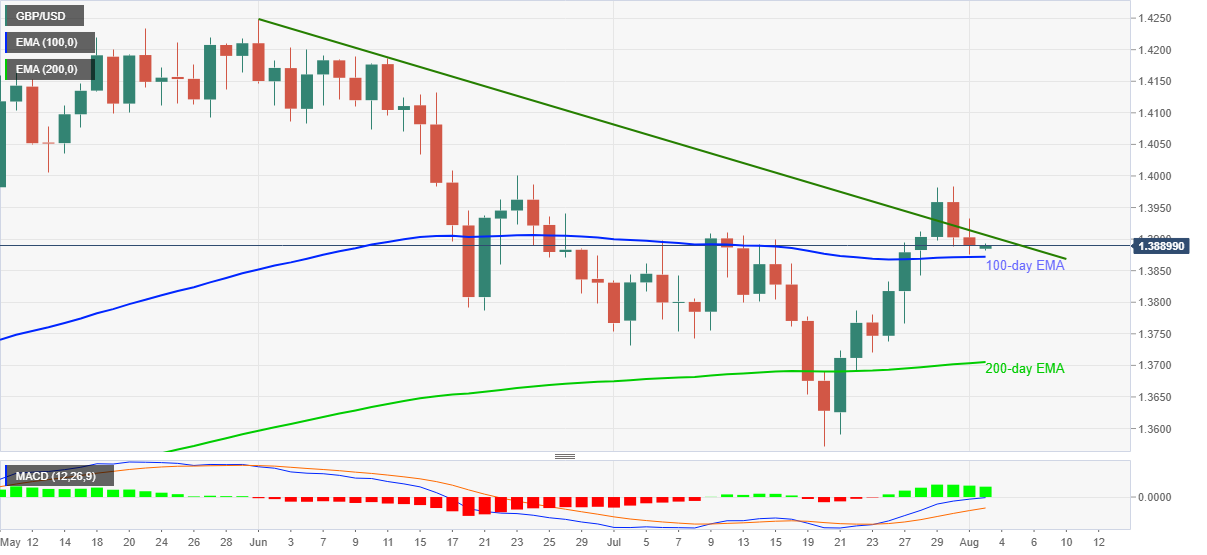
- Bullish MACD, sustained trading beyond key EMAs keep buyers hopeful.
- Two-month-old resistance line, July’s top guard immediate upside.
Having portrayed a two-day pullback from the highest levels since late June, GBP/USD licks its wounds around 1.3890 amid Tuesday’s Asian session.
In doing so, the cable seesaws between a downward sloping trend line from June 01 and 100-day EMA. However, bullish MACD and a successful rise above 200-day EMA favor buyers.
It’s worth noting that the GBP/USD buyers may not only wait for a clear run-up past the stated resistance line around 1.3910 but could also need a daily closing beyond July’s top of 1.3983 for conviction.
Following that, late June’s swing high near the 1.4000 threshold and a horizontal area surrounding 1.4100 will be the key to watch.
Alternatively, a downside break of 100-day EMA, near 1.3870, may recall the 1.3800 round figure to the chart before direct GBP/USD sellers to the early July’s low close to 1.3730.
In a case where the pair bears remain dominant past 1.3730, the 200-day EMA level of 1.3705 and the last month’s bottom surrounding 1.3570 should gain the market’s attention.
GBP/USD: Daily chart
Trend: Further recovery expected