WTI Price Analysis: Bulls battle 50-SMA on the way to $70.00
- WTI bulls take a breather following the biggest daily jump since late August.
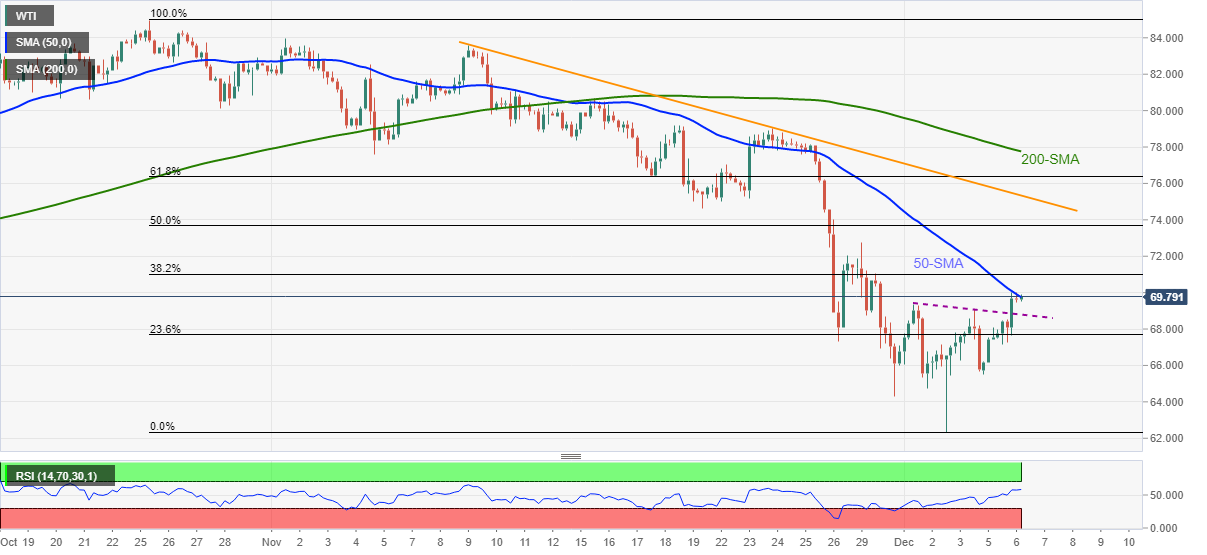
- Firmer RSI line, sustained break of weekly resistance keep buyers hopeful.
- Monthly resistance line, 200-SMA will be tough challenges for upside momentum.
WTI prints mild gains around $69.80, after rising the most since August 23 the previous day. That said, the black gold battles 50-SMA while keeping an upside break of weekly resistance, now support.
Given the upward sloping RSI line, not overbought, joining the aforementioned price-positive technical catalysts, the WTI crude oil is likely to extend the latest run-up to the $70.00 threshold. However, the late November’s swing high near $72.75 will test the oil buyers afterward.
In a case where the commodity prices rally past $72.75, 50% and 61.8% Fibonacci retracements of October 25 to December 02 fall, respectively around $73.70 and $76.40, will be in focus.
Also adding to the upside filter is the 200-SMA level of $77.75, a break of which will recall the $80.00 to the chart.
On the flip side, the previous resistance line near $68.80 can lure the short-term sellers during the pullback moves.
Following that, multiple supports around $65.60-50 may entertain WTI bears below directing them to the recently flashed multi-day bottom surrounding $62.30.
WTI: Four-hour chart
Trend: Further upside expected