GBP/JPY Price Analysis: Bulls extend the rally above 161.50 but will face strong resistance around 162.00
- On Tuesday, the GBP/JPY gained around 1.58%, pushing the weekly gains to 2.04%.
- Sentiment improved as Shanghai is about to lift restrictions, helping to ease the supply chain constraints.
- GBP/JPY Price Forecast: Upward biased, but bulls would face solid resistance around 162.00.
The GBP/JPY rallied for the third straight day and reached a fresh weekly high around 161.85, recording minimal gains as the Asian Pacific session began. At the time of writing, the GBP/JPY is trading at 161.67, up 0.07%.
Sentiment-wise, Wall Street’s session was positive, as reflected by US equities. Asian futures point to a higher open, courtesy of the improvement in the Covid-19 outbreak in China, particularly Shanghai, the second largest industrial hub in China, which reported zero coronavirus cases for the third consecutive day.
“From June 1 to mid-and late June, as long as risks of a rebound in infections are controlled, we will fully implement epidemic prevention and control, normalise management and fully restore normal production and life in the city,” deputy mayor Zong Ming said.
Meanwhile, on Tuesday, the GBP/JPY opened near the day’s lows, around 158.70s, and then rallied 250-pips during the day, breaking several figures on its way north, until settling around 161.50.
GBP/JPY Price Forecast: Technical outlook
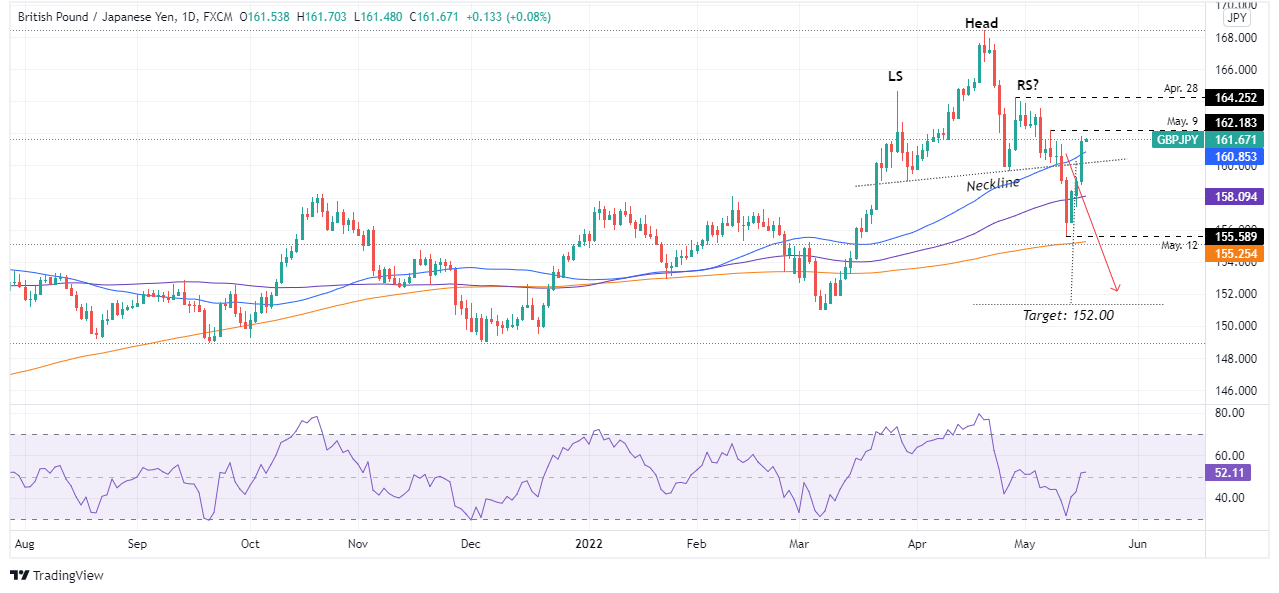
The GBP/JPY remains upward biased, as shown by the daily chart. However, traders need to be aware that a head-and-shoulders chart pattern is still in play, but a daily close above April 28 swing high at 164.25, would invalidate the chart pattern and would open the door for further gains.
Upwards, the GBP/JPY’s first resistance would be May 9, the daily high at 162.18. A breach of the latter would expose the 163.00 mark, followed by April 28 swing high at 164.25. On the other hand, the GBP/JPY first support would be the head-and-shoulders neckline around 160.00. Break below could send the pair aiming toward the 100-day moving average (DMA) at 158.09, followed by May 12 swing low at 155.58.
Key Technical Levels