GBP/USD Price Analysis: Pound rests in middle of the week's range, bulls in play
- GBP/USD has stalled above the recently made bear cycle lows.
- GBP/USD is approaching a price imbalance on the hourly chart, bulls eye break of 1.1516.
GBP/USD has been pressured to the lowest level since 1985 this week. However, it is trading in the middle of the week's range and as the following analyses illustrate, there are prospects of a bullish correction for the days and weeks ahead.
GBP/USD weekly charts
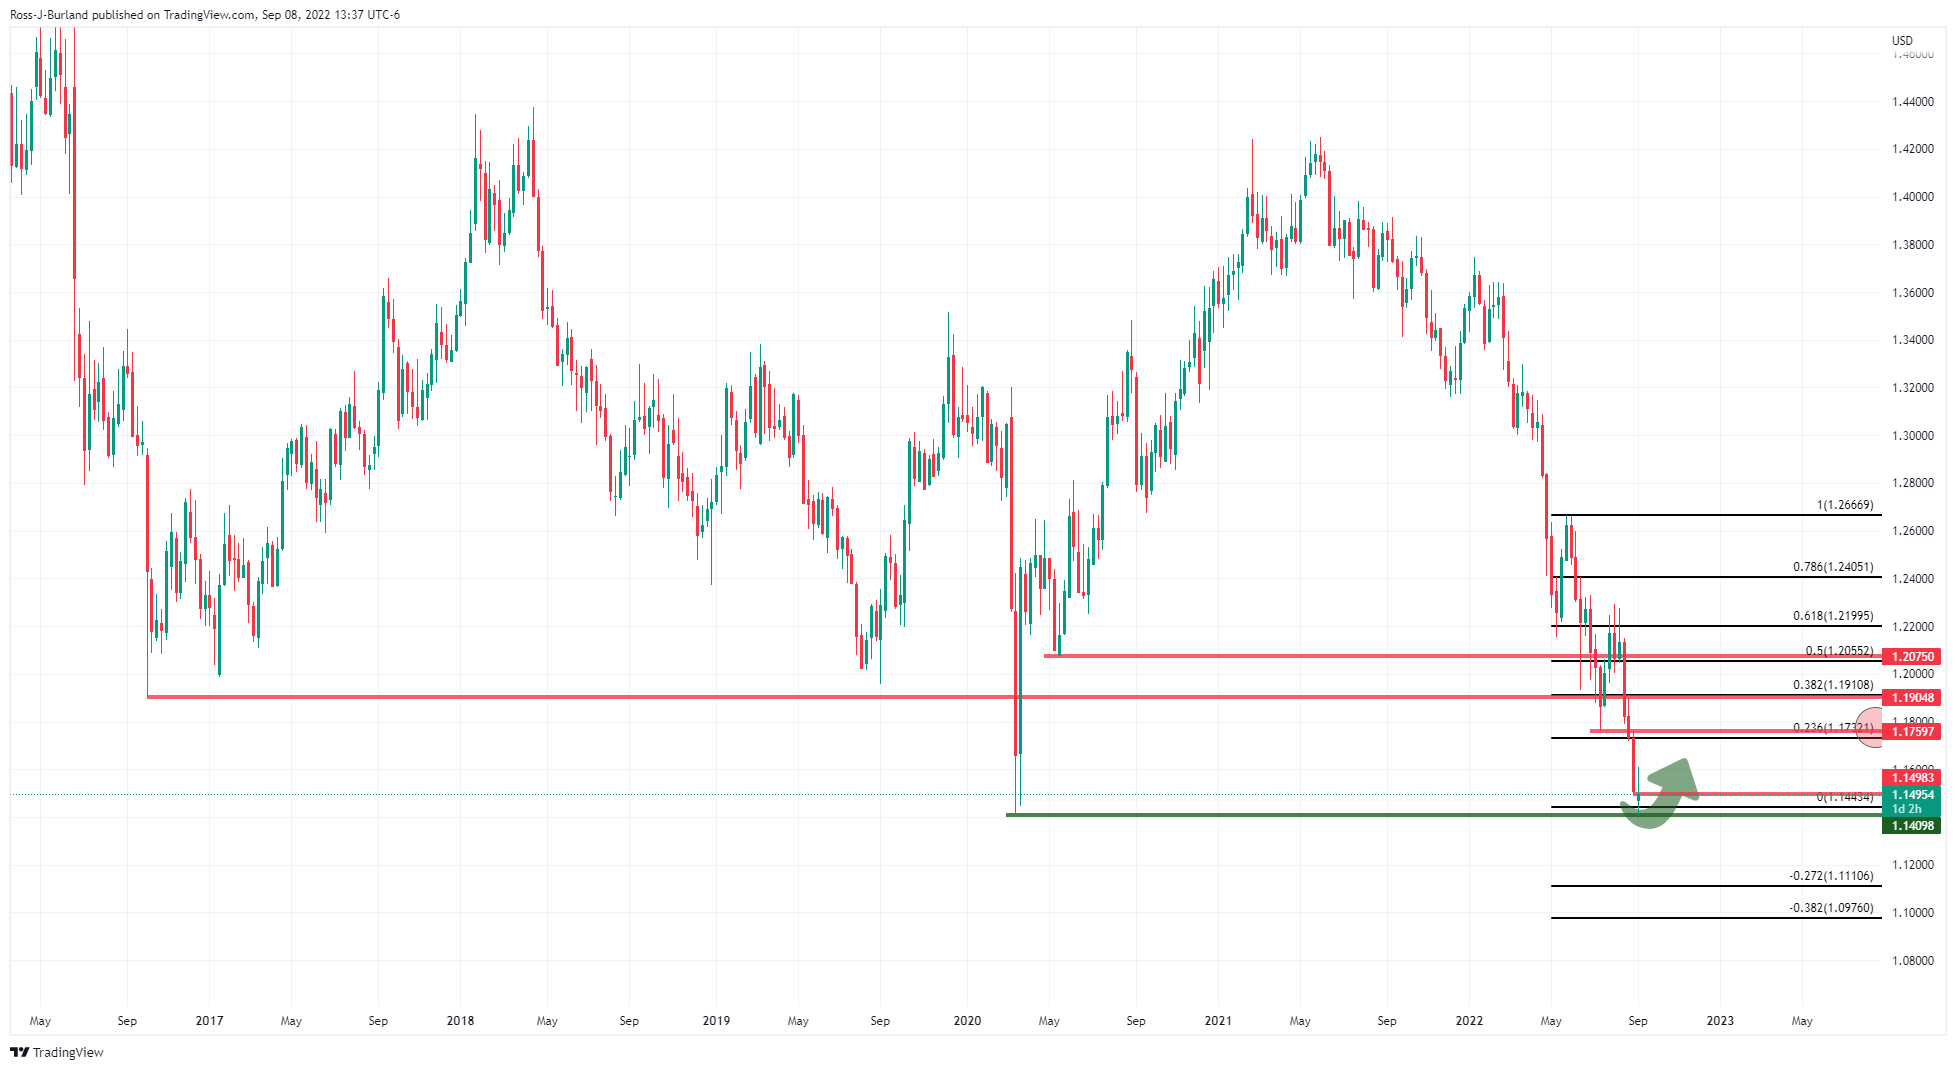
The weekly chart shows that the price is stalling at old support and a correction could be underway:

The bulls will be aiming for a break of the trendline resistance and the M-formation could be the catalyst for such a scenario. This is a reversion pattern that would typically see the price retrace to restest the neckline as old support turned resistance. If the bulls commit at this juncture, then a move above the formation will crystalise the bullish outlook for the weeks ahead.
GBP/USD daily chart
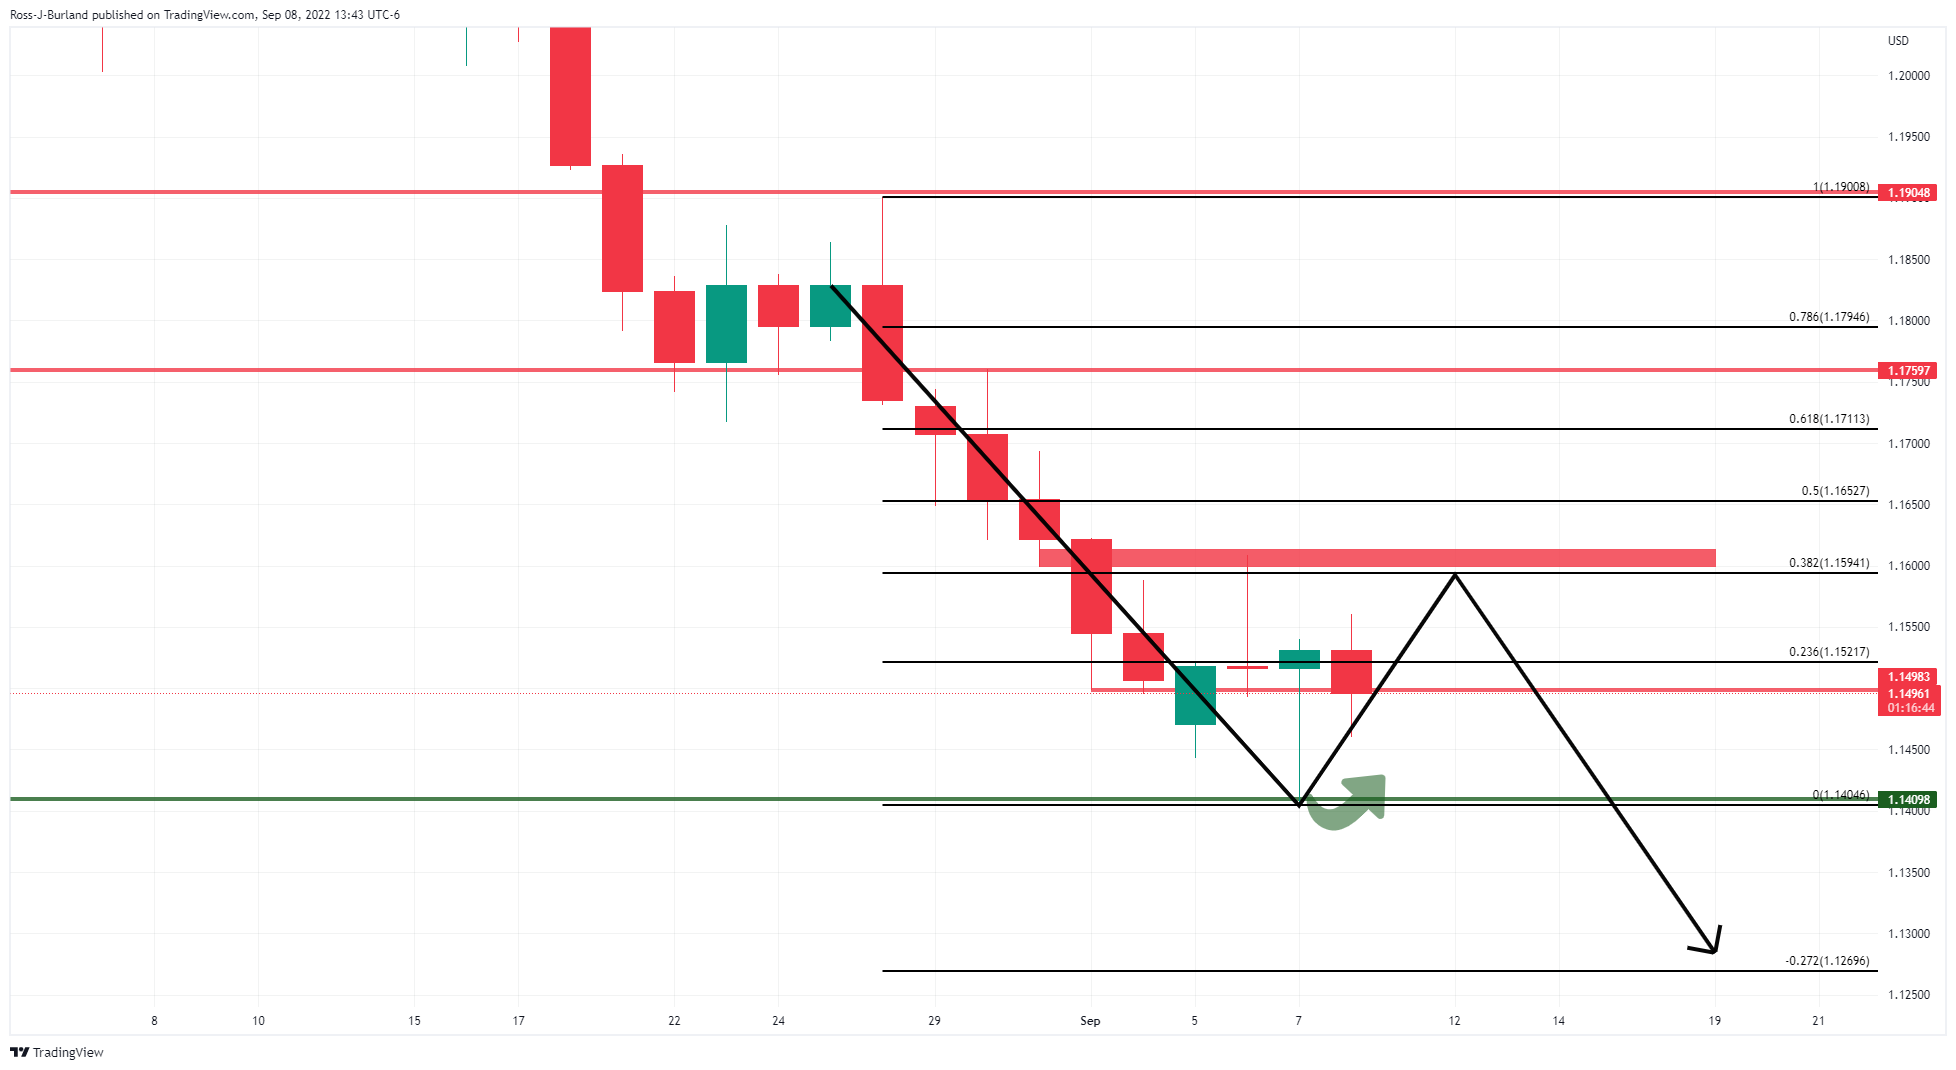
The daily chart, however, shows that 1.1600 could be a tough nut to crack as it has already resisted on the first attempt and now aligns with a 38.2% Fibonacci retracement level.
GBP/USD H1 chart
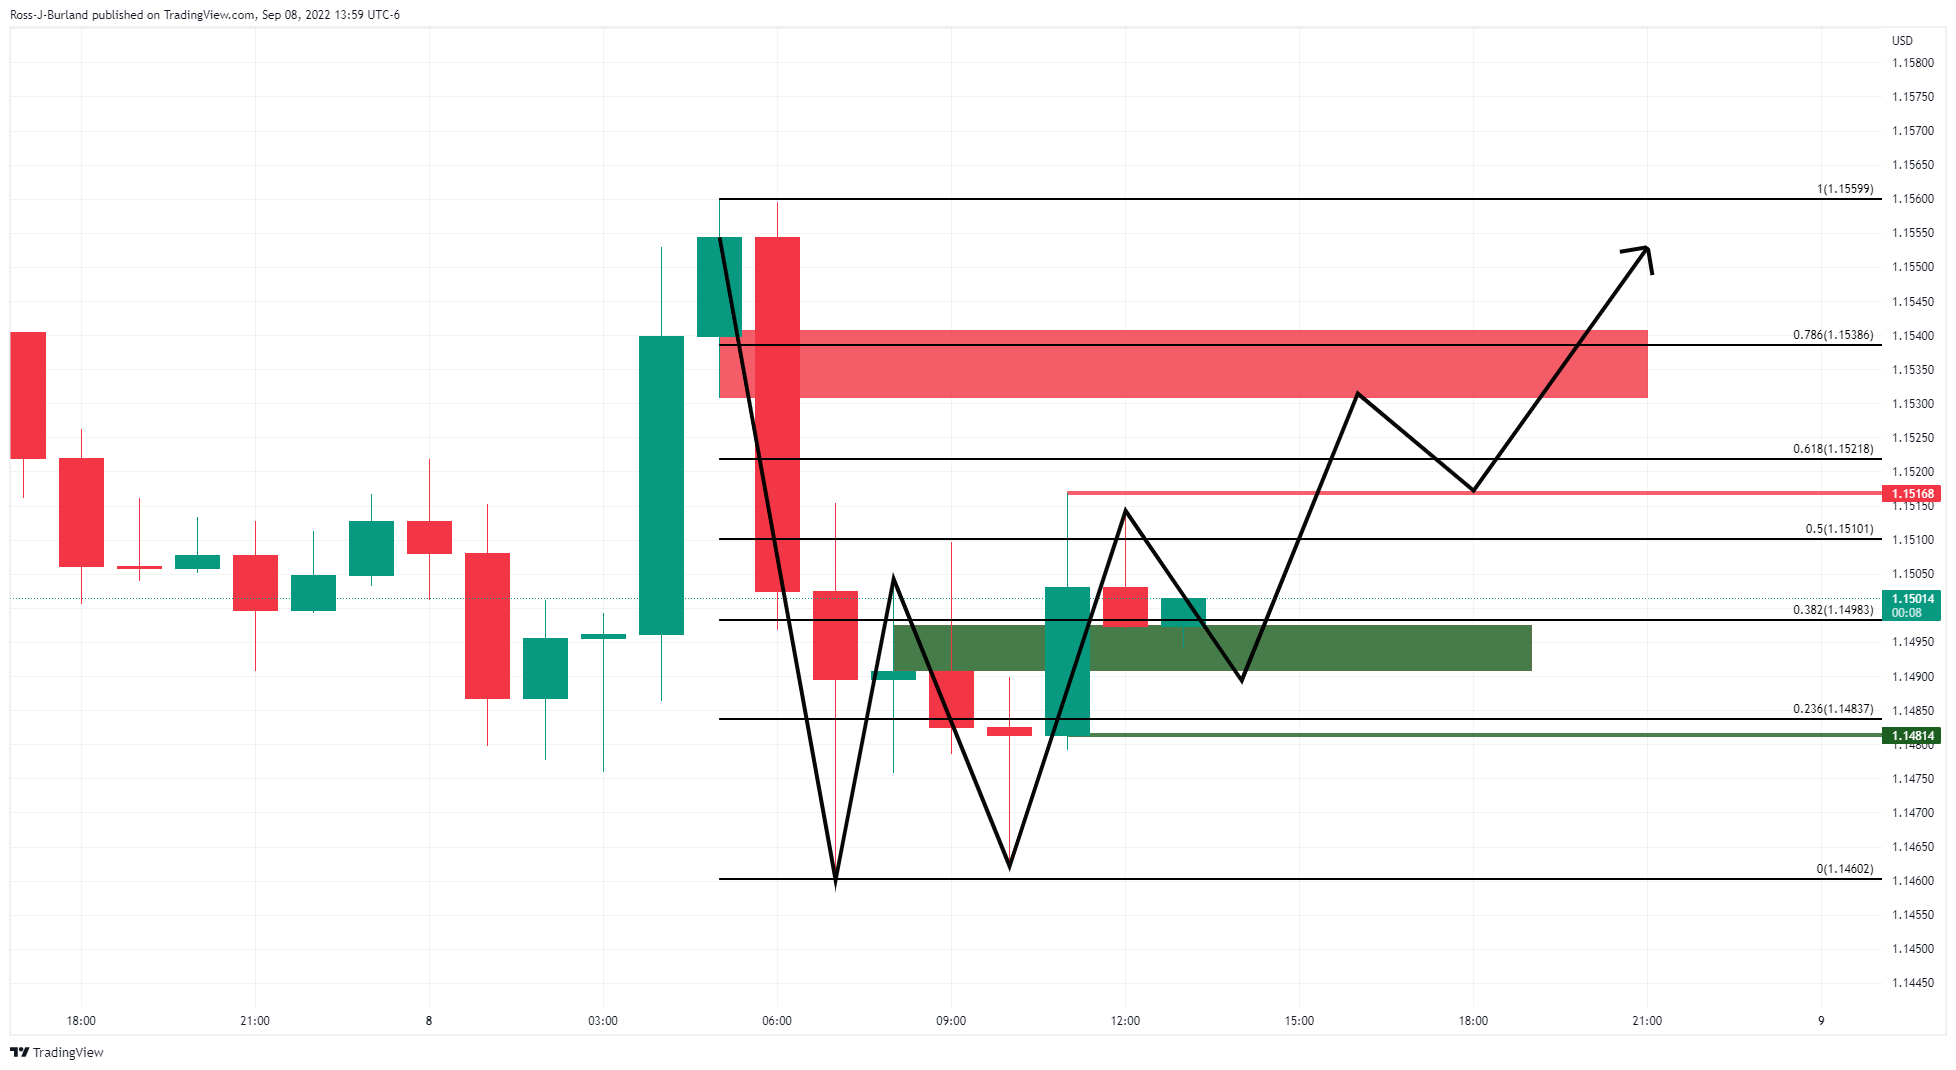
For the immediate future, the focus is on the upside for a retest of the highs. The price has left a W-formation on the chart and a break of 1.1516, the prior candle high, could seal the deal for a grind higher towards 1.1550 and beyond the recent highs.